After having studied 3 different patient series, we cannot conclude that HPV-status, Chung expression profile, CD44, hypoxia and miR-203 measurement on a pre-treatment biopsy should be the only markers we need to study in the future. Although important steps towards our understanding of head and neck cancer radioresistance, there are several reasons outlined below why more research is needed.
6.2.1 Patient numbers
First of all, the patient cohorts we have studied were all rather small, meaning just the largest effects in these series were statistically significant. For example, if we were to show a statistically significant (p-value < 0.05) effect for low versus high CD44 (or any other factor), assuming two groups of equal sizes, with an 80% probability to detect a statistically significant difference (power) in a group of head and neck cancer patients with a median survival of 2 years, a group 105 patients (65 events) would be needed to show the recurrence rate was twice as high (hazard ratio of 2.0), but only 17 patients (12 events) would be needed to show a five times worse recurrence rate (hazard ratio of 5.0) (35). To get an insight into patient numbers needed, different parameters can be entered into sample size calculators, for example on this website: sample size calculator. Keeping in mind that fairly large numbers of patients are needed to show a significant effect with a moderate difference between two groups, we could for example re-evaluate results found in chapter 2. Low CD44 expression appeared to be a favorable factor in the group of patients in chapter 2, but did not reach statistical significance. When compared to a similar but larger series recently published by Linge et al. (36), CD44 is significantly correlated with locoregional control as can be seen in figure 6.1. Meaning other factors in our analyses could have wrongly been judged to be ‘insignificant’, while they were only lacking sufficient patient numbers.
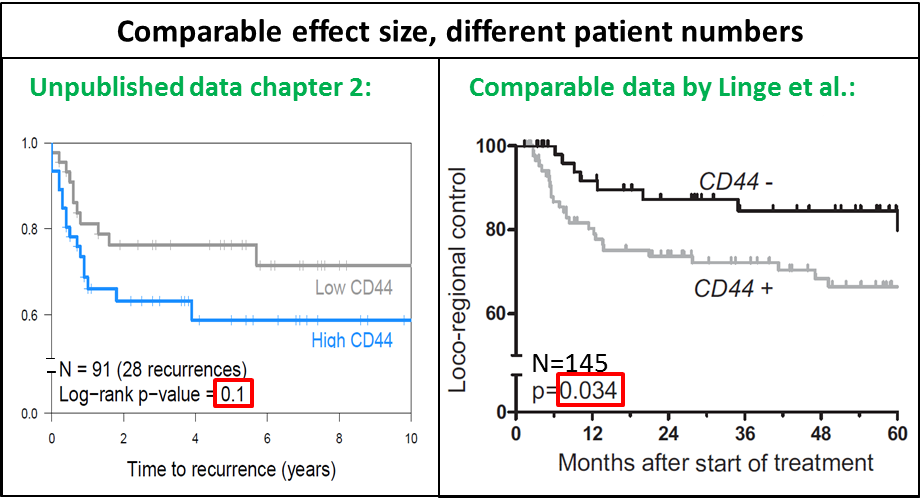
Figure 6.1: Kaplan Meier curves for CD44 in two groups in two different series. Left panel: unpublished plot from 91 patients in chapter 2, right panel: Curves for 145 patients, adapted figure 2D from Linge et al. (36).
6.2.2 Cutoff values
Sample size will not only limit the detection to only the largest effects in a series, but also make it more difficult to find statistical significance if a factor is present in only a small subset of patients. Additionally, in many of our analyses, we split patients in two groups (using the median expression) for lack of knowledge of the actual cutoff. This is statistically sound to do if the cutoff is unknown and will produce stable results, but it might also miss factors that turn out to be important. In the unpublished plots in figure 6.2, it can be observed that if a cutoff at the first tertile instead of the median had been chosen, results would have been significant.
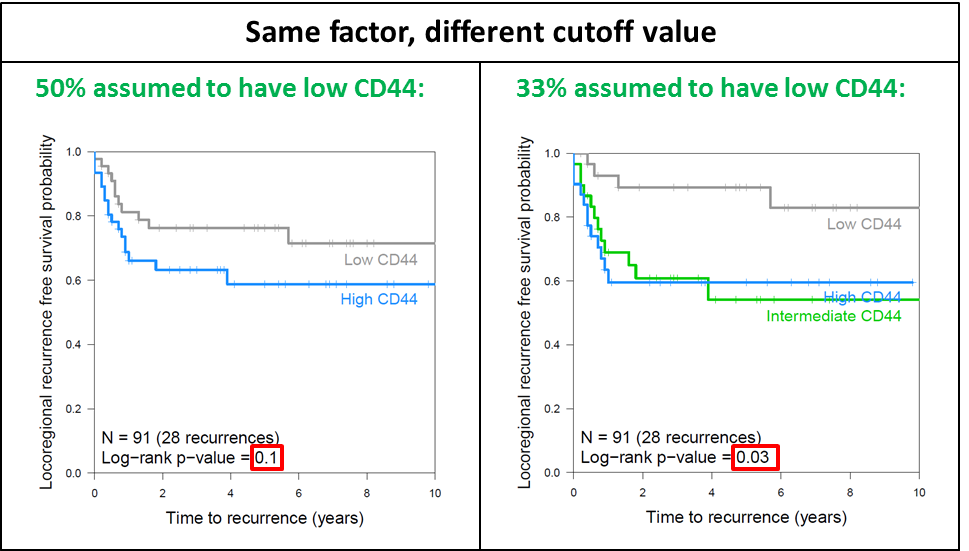
Figure 6.2: Kaplan Meier curves for CD44 in two or three groups. Unpublished plots from 91 patients in chapter 2. Comparison of a cutoff at the median (left panel) or in tertiles (right panel).
6.2.3 Interactions between factors
With small patient groups and numerous potential predictors of outcome, it is increasingly difficult to perform subgroup analyses or study different interactions between factors. Again, re-analyzing the data from chapter 2, where CD44 was not a significant factor, an interaction between HPV status and CD44 expression could have caused the ‘insignificance’ of CD44 in the original analysis (figure 6.3). Because laryngeal tumors are rarely HPV positive, this was not a confounder in the analyses of chapter 3, and again emphasizes the importance of the study of homogeneous groups of patients.
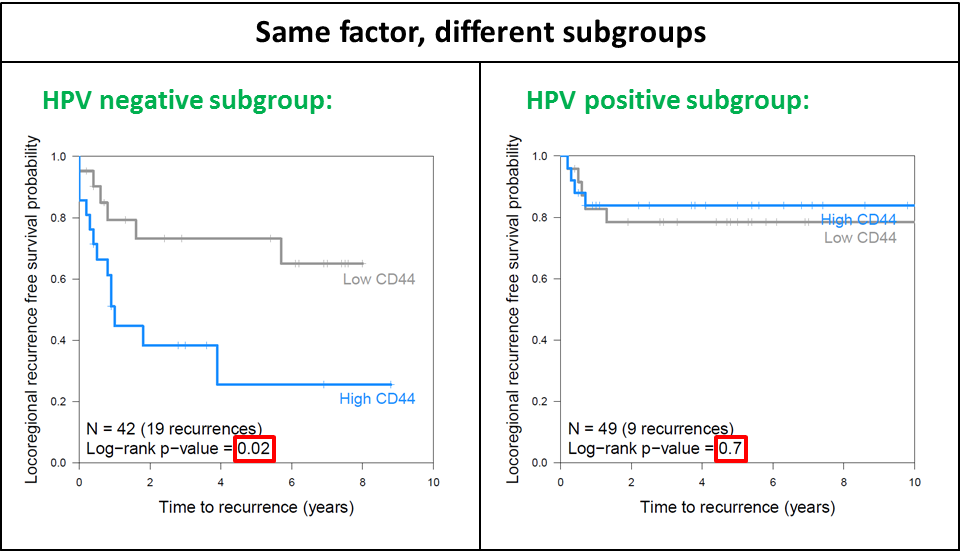
Figure 6.3: The effect of high or low CD44 expression on locoregional recurrence in two subgroups: HPV negative tumors (left panel) and HPV-positive tumors (right panel).
Not only HPV and CD44 show an interaction, but many correlations and interactions exist between different factors know to influence response to radiotherapy. Assuming that all 18 clinical and biological factors as mentioned in the introduction (age, sex, hemoglobin, health, smoking, T-stage, tumor volume, N-stage, tumor subsite, grade, HPV status, hypoxia, repopulation, redistribution, intrinsic sensitivity, stem cells, microenvironment, energy metabolism) are of importance for the prediction of control after radiotherapy and we would have two levels for all of those factors, we could make 324 (182) different groups that could possibly all have their own response rates. Obviously, many of those 324 combinations would have the same cure rates, since there is only so much room to make subgroups between 0 and 100% response rates. However, two groups with the same response rates to radiotherapy could have very different reasons for their failures. Especially different biological reasons for failure would be important to distinguish, since they would most likely result in different proposed treatment adaptations. An overview of some of the interactions for the different biological processes thought to contribute to radiotherapy response can be seen in table 6.1.
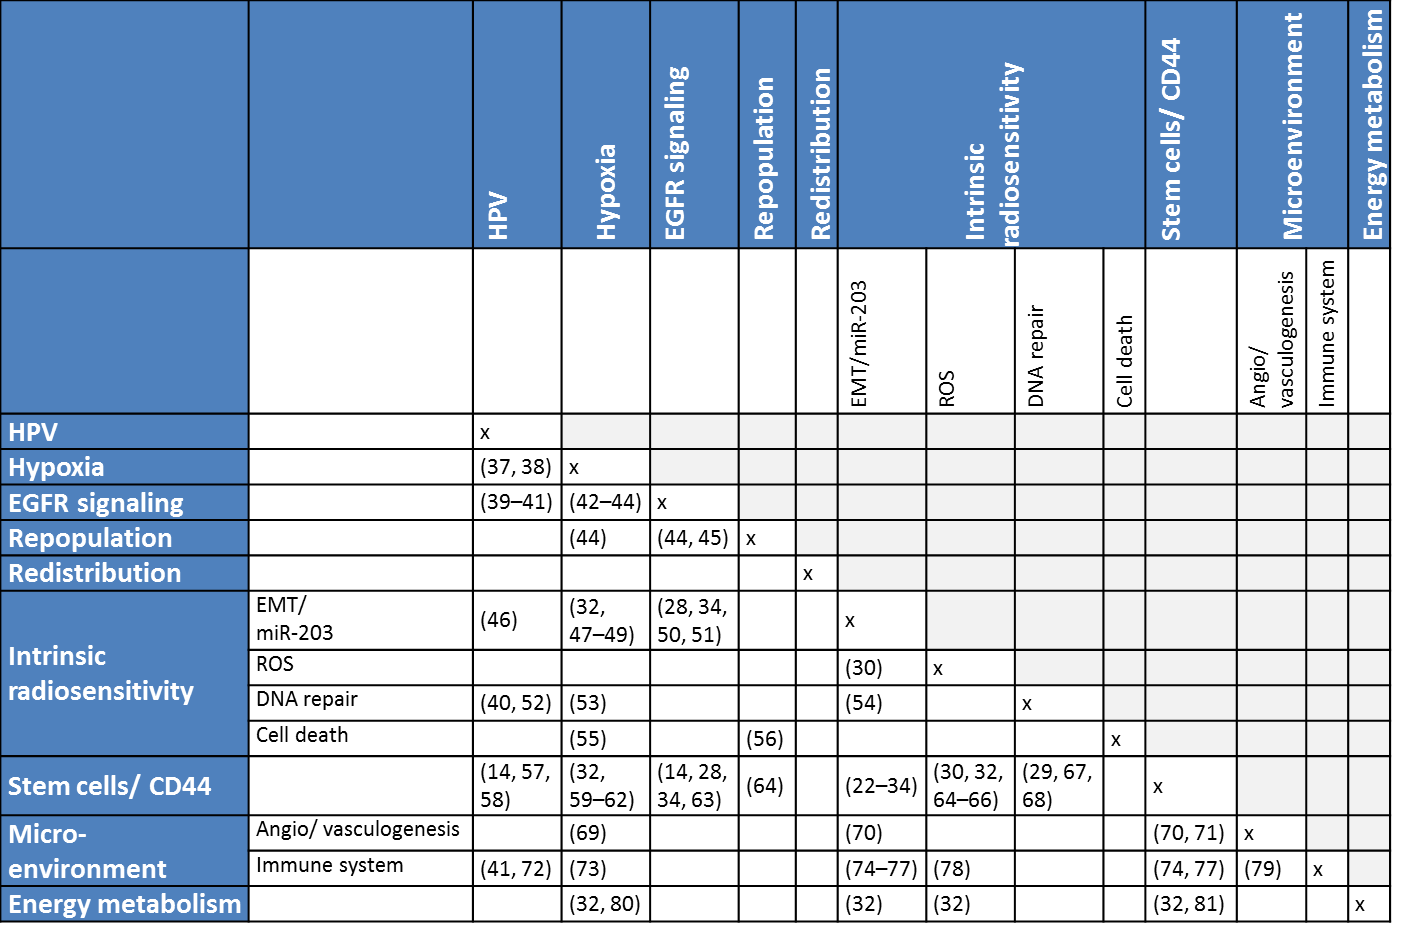
Table 6.1. Interactions and correlations between different biological processes thought to contribute to radiotherapy response described in literature. Click here for hyperlinks to references: 14, 22, 23, 24, 25, 26, 27, 28, 29, 30, 31, 32, 33, 34, 37, 38, 39, 40, 41, 42, 43, 44, 45, 46, 47, 48, 49, 50, 51, 52, 53, 54, 55, 56, 57, 58, 59, 60, 61, 62, 63, 64, 65, 66, 67, 68, 69, 70, 71, 72, 73, 74, 75, 76, 77, 78, 79, 80, 81.
6.2.4 Prognostic vs. predictive factors
Another reason why we cannot start the immediate improvement of head and neck cancer radiotherapy with the use of HPV-status, Chung expression profile, CD44 and miR-203 measurements, is that so far they are prognostic and not certainly predictive (yet). A prognostic biomarker only has the ability to foretell outcome (irrespective of treatment), while a predictive biomarker is able to separate responders from non-responders to a certain therapy, meaning it can help support treatment decisions (82). So far, there are few predictive markers for head and neck cancer. A few markers have been found using retrospective analyses on randomized trials comparing two treatment arms. In a trial of normal overall treatment time versus accelerated radiotherapy, patients with high EGFR expression benefitted from accelerated radiotherapy, while the acceleration added no benefit in the group of patients with low EGFR expression (83, 84). However, EGFR expression is not currently used to decide whether a patient should have accelerated radiotherapy. Another predictive marker was found in a trial of hypoxia modification and radiotherapy, only the patients with a high hypoxia gene expression showed an improvement upon addition of nimorazole to radiotherapy (85). This hypoxia profile is now evaluated in a large prospective study (86). Furthermore, there is progress in the discovery of predictive biomarkers for response to EGFR-inhibitors (87, 88).
Ultimately, prognostic markers can be turned into predictive markers if the right (targeted) therapy is available. If for example, a CD44 inhibitor would only improve radiotherapy if added when a patient has a high expression of CD44, it would be predictive.