Published hypoxia gene sets
To our knowledge, four gene expression sets for hypoxia that have been validated to predict outcome in head and neck cancer exist (table 5.1):
1. Winter et al. [29] profiled 59 head and neck cancer patients and obtained a hypoxia metagene signature, selecting genes whose in vivo upregulation coincided with the upregulation of 10 well-known hypoxia genes. The 99-gene signature correlated with recurrence free survival in a published series of 60 head and neck cancer patients mostly treated with surgery followed by radiotherapy [35].
2. Buffa et al. [30] used hypoxia-regulated genes to select co-expressed genes in three head and neck and five breast cancer studies. The resulting 51-gene signature was validated in 4 independent datasets.
3. Toustrup et al. [15] generated a 15-gene signature from in vitro experiments and an association of gene expression data from 58 head and neck cancer biopsies with various hypoxia levels from previous eppendorf hypoxia measurements. The 15-gene hypoxia classifier was validated and proven to be predictive for hypoxia modification (nimorazole) benefit in 323 patients treated in a randomized study of nimorazole versus placebo during radiotherapy for head and neck cancer.
4. Eustace et al. [31] generated a 26-gene reduced signature using the methods and starting genes from Buffa et al.. This signature was tested on 157 laryngeal cancer patients treated with radiotherapy alone or with carbogen and nicotinamide. The 26-gene signature predicted recurrence rate improvement upon hypoxia-modifying treatment.
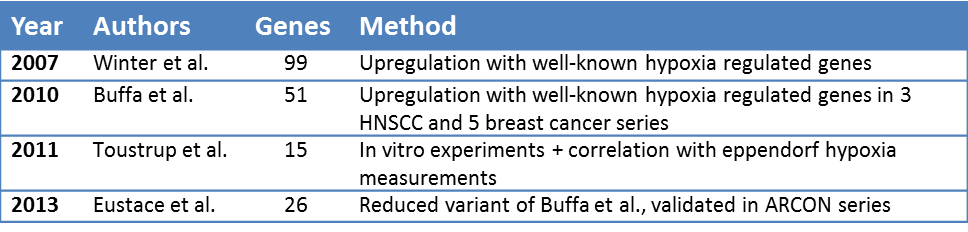
Table 5.1: Overview of published hypoxia gene sets that have been validated in head and neck cancer.
In vitro hypoxia response data
To compare the published hypoxia signatures with acute and chronic hypoxia expression profiles, temporal transcription changes in response to hypoxia generated by Chi et al. were used [36]. They have studied hypoxia response patterns in epithelial cells using DNA microarrays. Gene signatures were extracted from cells at different time points between 1 and 24 hours under <0.02% or 2% oxygen [37]. Time points between 0-6 hours were used to describe early response and time points 12 and 24 hours late response, resulting in 4 signatures: early-0%, early-2%, late-0% and late-2%, consisting of respectively 70, 34, 65 and 29 unique gene symbols. These signatures were used for comparison with the four published signatures.
Patient data
To compare the classification of the different signatures, we used pre-treatment gene expression data of three different patient cohorts, comprising a total of 224 patients (table 5.2). More extensive patient characteristics for the cohorts can be viewed in the original publications and in Supplementary table 5.1-5.3.
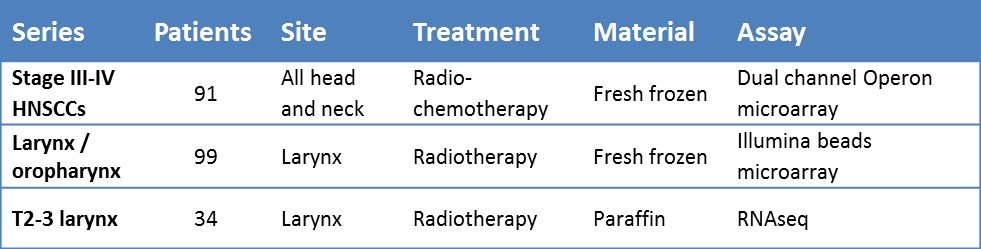
Table 5.2. Summary of characteristics of the three patient series.
The first series of 91 patients treated with radiochemotherapy was previously published by Pramana et al [38]. Gene expression profiles were obtained from fresh-frozen pre-treatment material, analyzed using dual-channel Operon microarray slides. Follow-up data were updated and annotations of reporters for different probes on the microarrays were updated to the latest HUGO gene symbols.
Data of the second series were partly published, methods are as described in de Jong et al.. For this analysis more patients were added to the series [39]. Briefly, gene expression of 99 fresh-frozen larynx and oropharynx carcinomas, all treated with single modality radiotherapy, was measured using the Illumina beads microarray platform. Annotations of reporters for different probes on the microarrays were updated to the latest HUGO gene symbols.
The patient characteristics of the third series have been published previously [40]. This series consists of 34 larynx carcinomas, of which messenger RNA was isolated from paraffin embedded material and sequenced using the Illumina HiSeq2000, full methods for the mRNA extraction and sequencing can be read in the supplementary methods.
Testing signatures
All signatures consisted exclusively of genes that were upregulated under hypoxia. Therefore, the mean expression of the genes in each signature was calculated as a measure of hypoxia status for every tumor. In order to compare three patient series with expression data that were generated using different gene expression assays, scores were rank-normalized per signature between 0 and 1 for each of the three patient series before they were combined.
Hypoxia profiles and radiotherapy response
In order to study the effect of the different hypoxia signatures on (chemo-)radiotherapy response prediction, local recurrence rates for different hypoxia scores were compared in the chemoradiotherapy cohort. Per gene profile (or per group of corresponding gene profiles), patients were divided into two groups by the median rank. Kaplan-Meier statistics were used to assess the difference in recurrence free survival between two groups.