Gene expression
Gene expression analysis.
Exclusion of probes that did not exceed background expression in any patient left 26,454 probes for analysis. Gene expression signatures for hypoxia, intrinsic radiosensitivity, repopulation and stem cells were analyzed in a logistic regression (Table 3.3). The putative stem cell marker CD44 was the most significant, with an unrelated stem cell signature as second most significant. A third stem cell signature not including CD44 (Table 3.4) was fifth of the 12 signatures tested but was not significant. After multiple testing correction (Bonferroni), only CD44 expression remained significant (P = 0.024). Comparative histograms of CD44 expression illustrate the higher expression in recurrences versus cures (Figure 3.2A). When patients were divided into three groups of low, medium and high CD44 expression, split so that there were equal numbers of recurrences in each group, the odds of recurrence (number of recurrences divided by number of non-recurrences for each group) was 15.2 fold higher in the highest CD44 expression group compared with the lowest (P = 0.003, Figure 3.2B). Expression of acute hypoxia genes was also associated with local recurrence, although significance was lost after correction for multiple testing. Radiosensitivity and proliferation genes showed no relationship with recurrence.
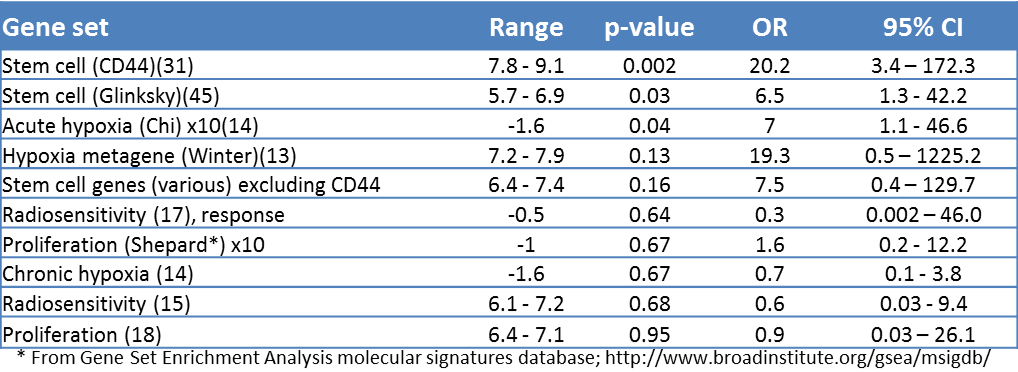
Table 3.3. Logistic regression of gene sets with local recurrence. Range: lowest to highest value of either Pearson correlations against the weights of a gene set or, for gene sets without weights, the average expression (log2 scale) of the genes in the set. OR: odds ratios with corresponding confidence intervals and p-values were generated from a logistic regression of Pearson or average values of the gene sets with local recurrence data. In order to give comparable odds ratios, some Pearson correlations were multiplied by 5 or 10 (not changing the p-values). *From Gene Set Enrichment Analysis molecular signatures database; http://www.broadinstitute.org/gsea/msigdb.
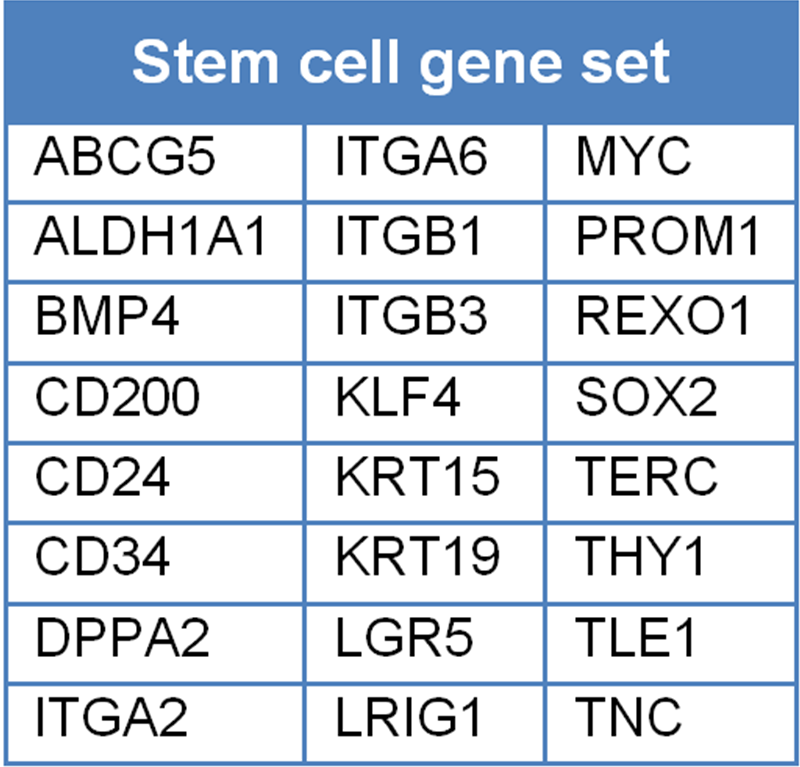
Table 3.4. Stem cell gene set, excluding CD44, gene symbols derived from various sources by the authors.
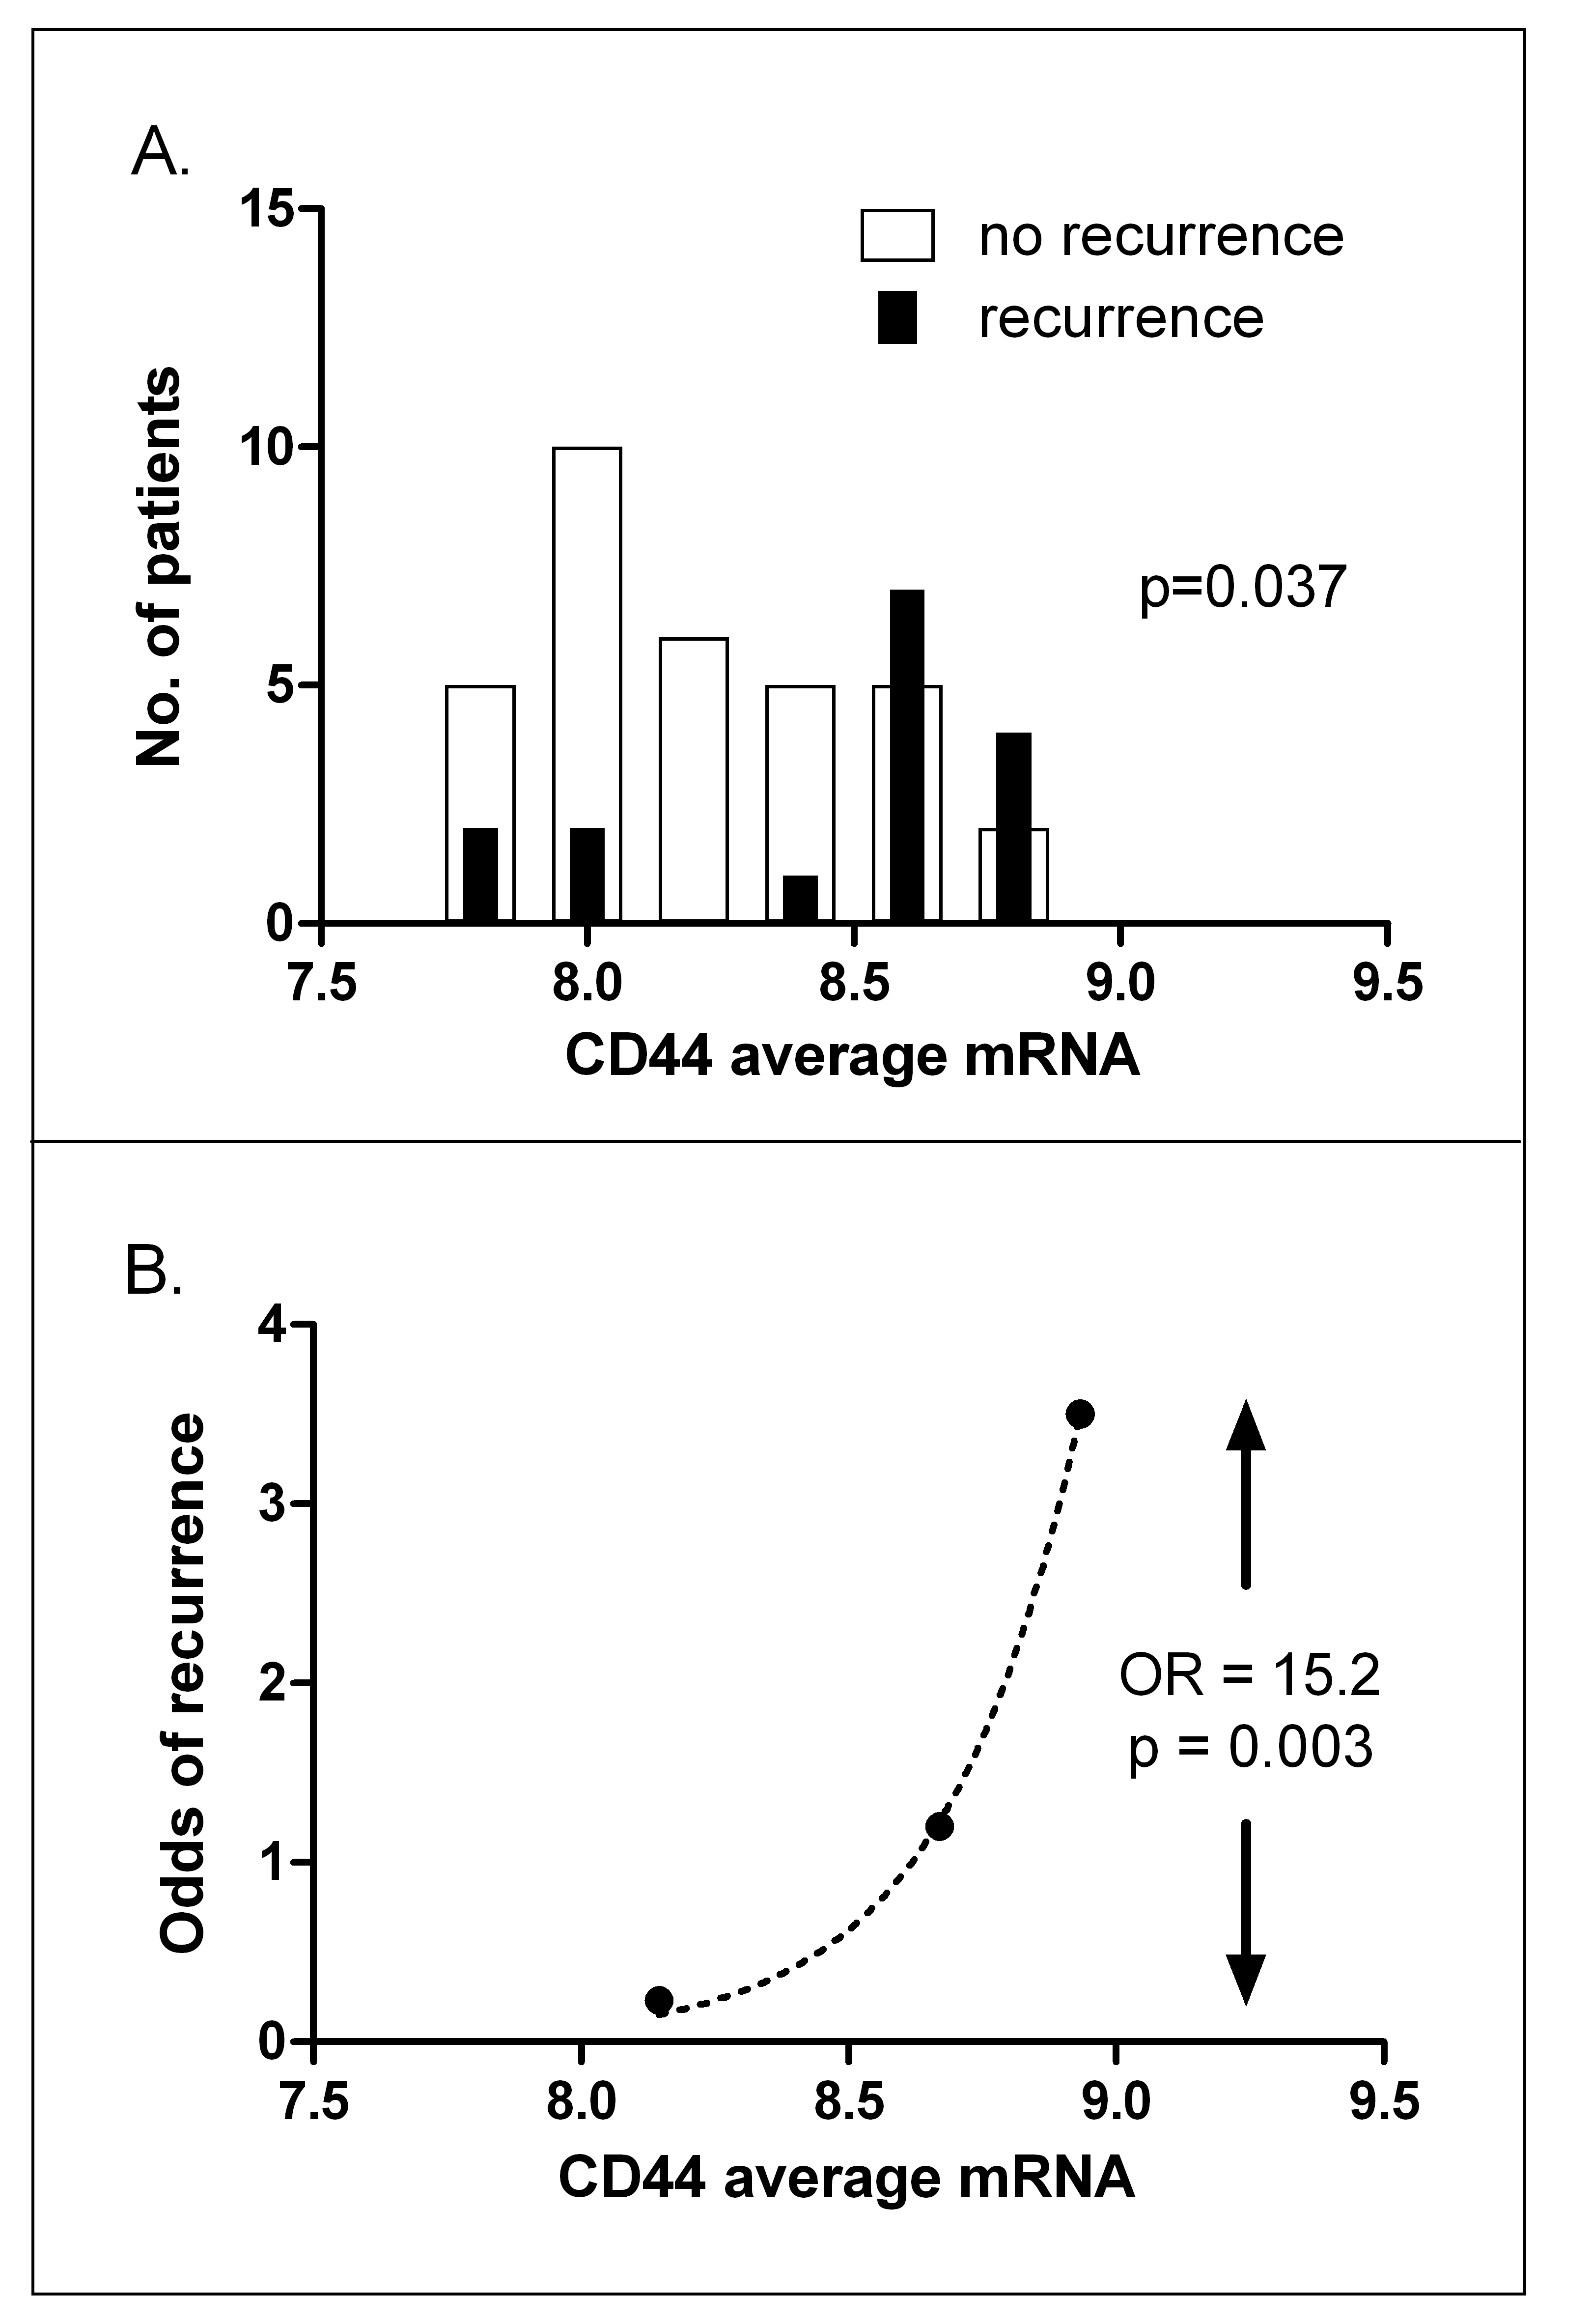
Figure 3.2. CD44 expression predicts local recurrence. A, histograms of CD44 mRNA expression for patients subsequently cured (open bars) or those subsequently suffering a recurrence (closed bars). B, odds of recurrence when patients are divided into three groups with increasing mRNA levels, split so that each group contains equal numbers of recurrences. OR: odds ratio of recurrence between highest and lowest CD44 expression groups.
After restriction of the dataset to those 8,317 probes that showed significant differences in expression between the tumors, thus removing uninformative probes, we performed a data-driven analysis for which genes best predicted recurrence. When the univariate significance alpha level was set to P < 0.01, 34 probes (18 up and 16 down-regulated in tumors subsequently recurring) were found to be predictive (Table 3.5). The most significant upregulated marker discriminating between cures and recurrences was CD44 (P < 0.002). With the nearest centroid method only 23% of the patients were correctly classified with these 34 genes. In addition, false discovery rates, as calculated by the Benjamini-Hochberg method, were high. However, despite the predictive weakness of the signature as a whole, of note was that all three probes for CD44 that were present on the array appeared in the top 10 highest ranking upregulated genes. Two of the probes (variants 4 and 5) map to the constant and largest exon (exon 18), while variant 1 maps to the first variable exon (exon 6). Expression of each probe was highly significantly correlated with expression of each of the other probes across the 52 tumors (all P-values <0.001; 1 vs 3, 1 vs 5, 3 vs 5).
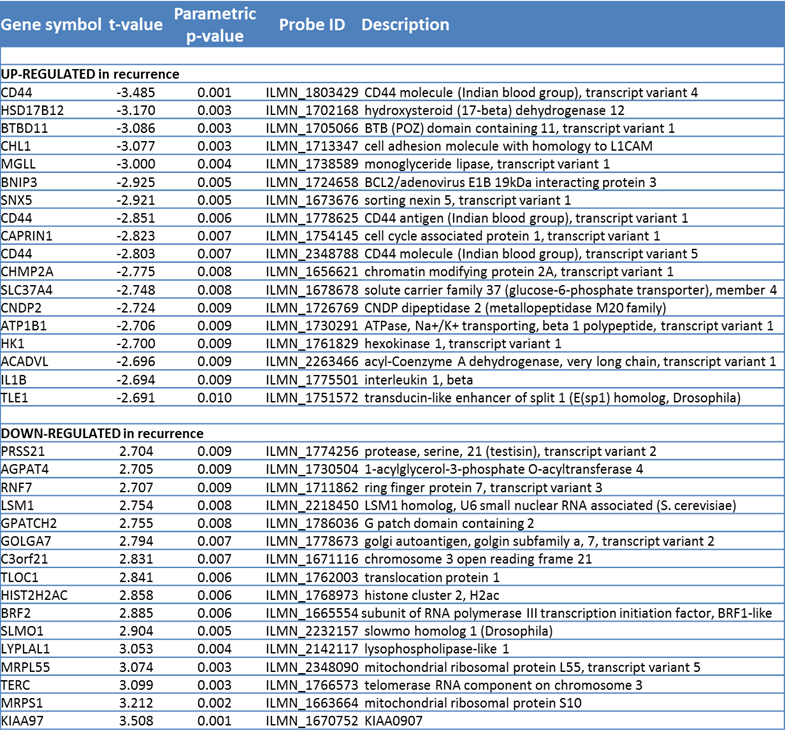
Table 3.5. Data driven classifier, showing top 34 most significant genes, all with a P-value <0.01.
In addition to CD44, the remaining top ranking genes from Table 3.5 were most highly represented in a pathway relevant to “cell cycle, cellular development, cellular growth and proliferation” (from Ingenuity Pathway Analysis). This pathway contained EGF, VEGF, and HRAS as hub genes and of 35 genes on the pathway, 11 appeared in list of top ranking genes (Figure 3.3).
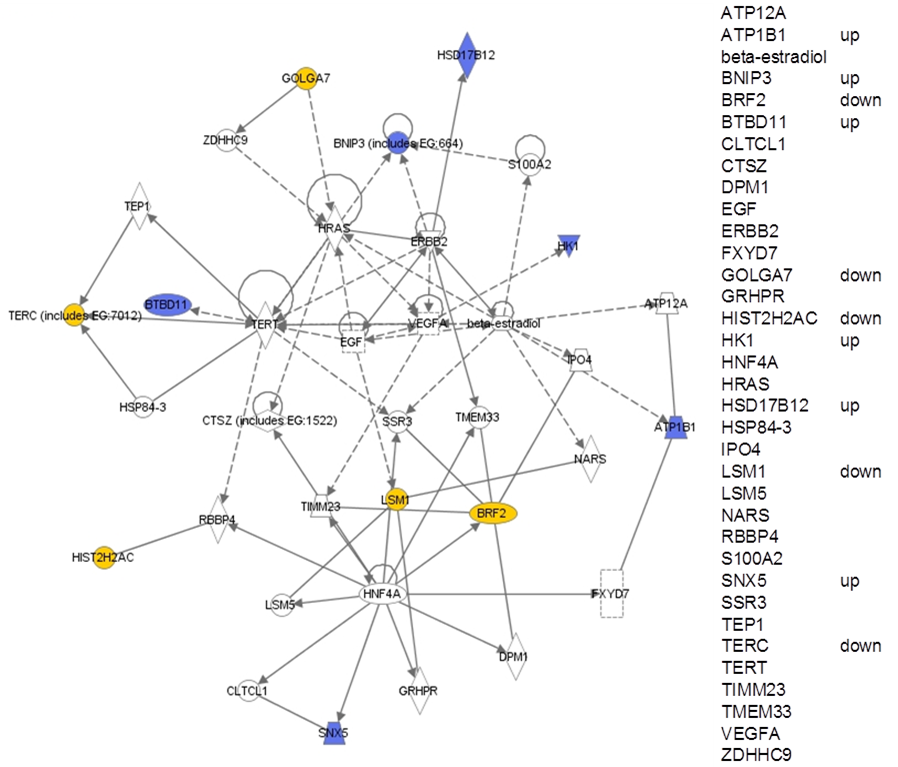
Figure 3.3. Highest ranking pathway from Ingenuity Pathway Analysis of the top 34 genes arising out of the data-driven analysis of cures versus recurrences (see table 3.5). Blue: up regulated in recurrences; yellow: downregulated in recurrences. For clarity, all genes are also listed on the right, indicating whether they are up or down regulated.
CD44 protein level versus outcome
CD44 mRNA correlates with immunohistochemical expression.
Both frozen and paraffin embedded material was readily available from 20 tumors and used to compare RNA and protein expression. Antibodies were tested against an epitope common to all CD44 variants and one specific for the v6 variant. Figure 3.4 shows examples of CD44 staining. All tumors showed some expression (with on average 24% of tumor cells staining with a low intensity and 52% with a high intensity) although the staining was heterogeneous in all cases. In tumors showing a clear differentiation pattern, the basal cell layers were more intensely stained than the more differentiated cells. Both the CD44 and the CD44v6 immunostaining scores correlated significantly (P < 0.05) with the average for all three CD44 mRNA probe levels (Figure 3.5).
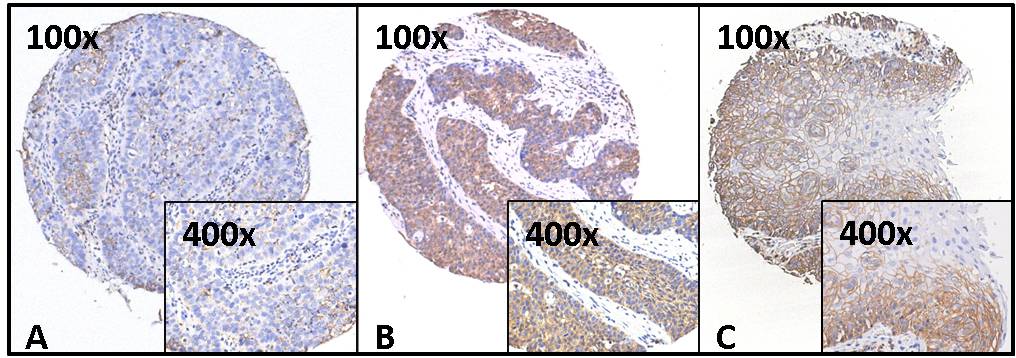
Figure 3.4. Examples of CD44 immunohistochemistry. Staining, using antibody 156-3C11, against an epitope common to all CD44 variants, on the tissue microarray for three representative cores at two different magnifications (100× and 400×). Scorings for these cores were: A: 40% intensity I. B: 95% intensity II. C: 80% intensity II.
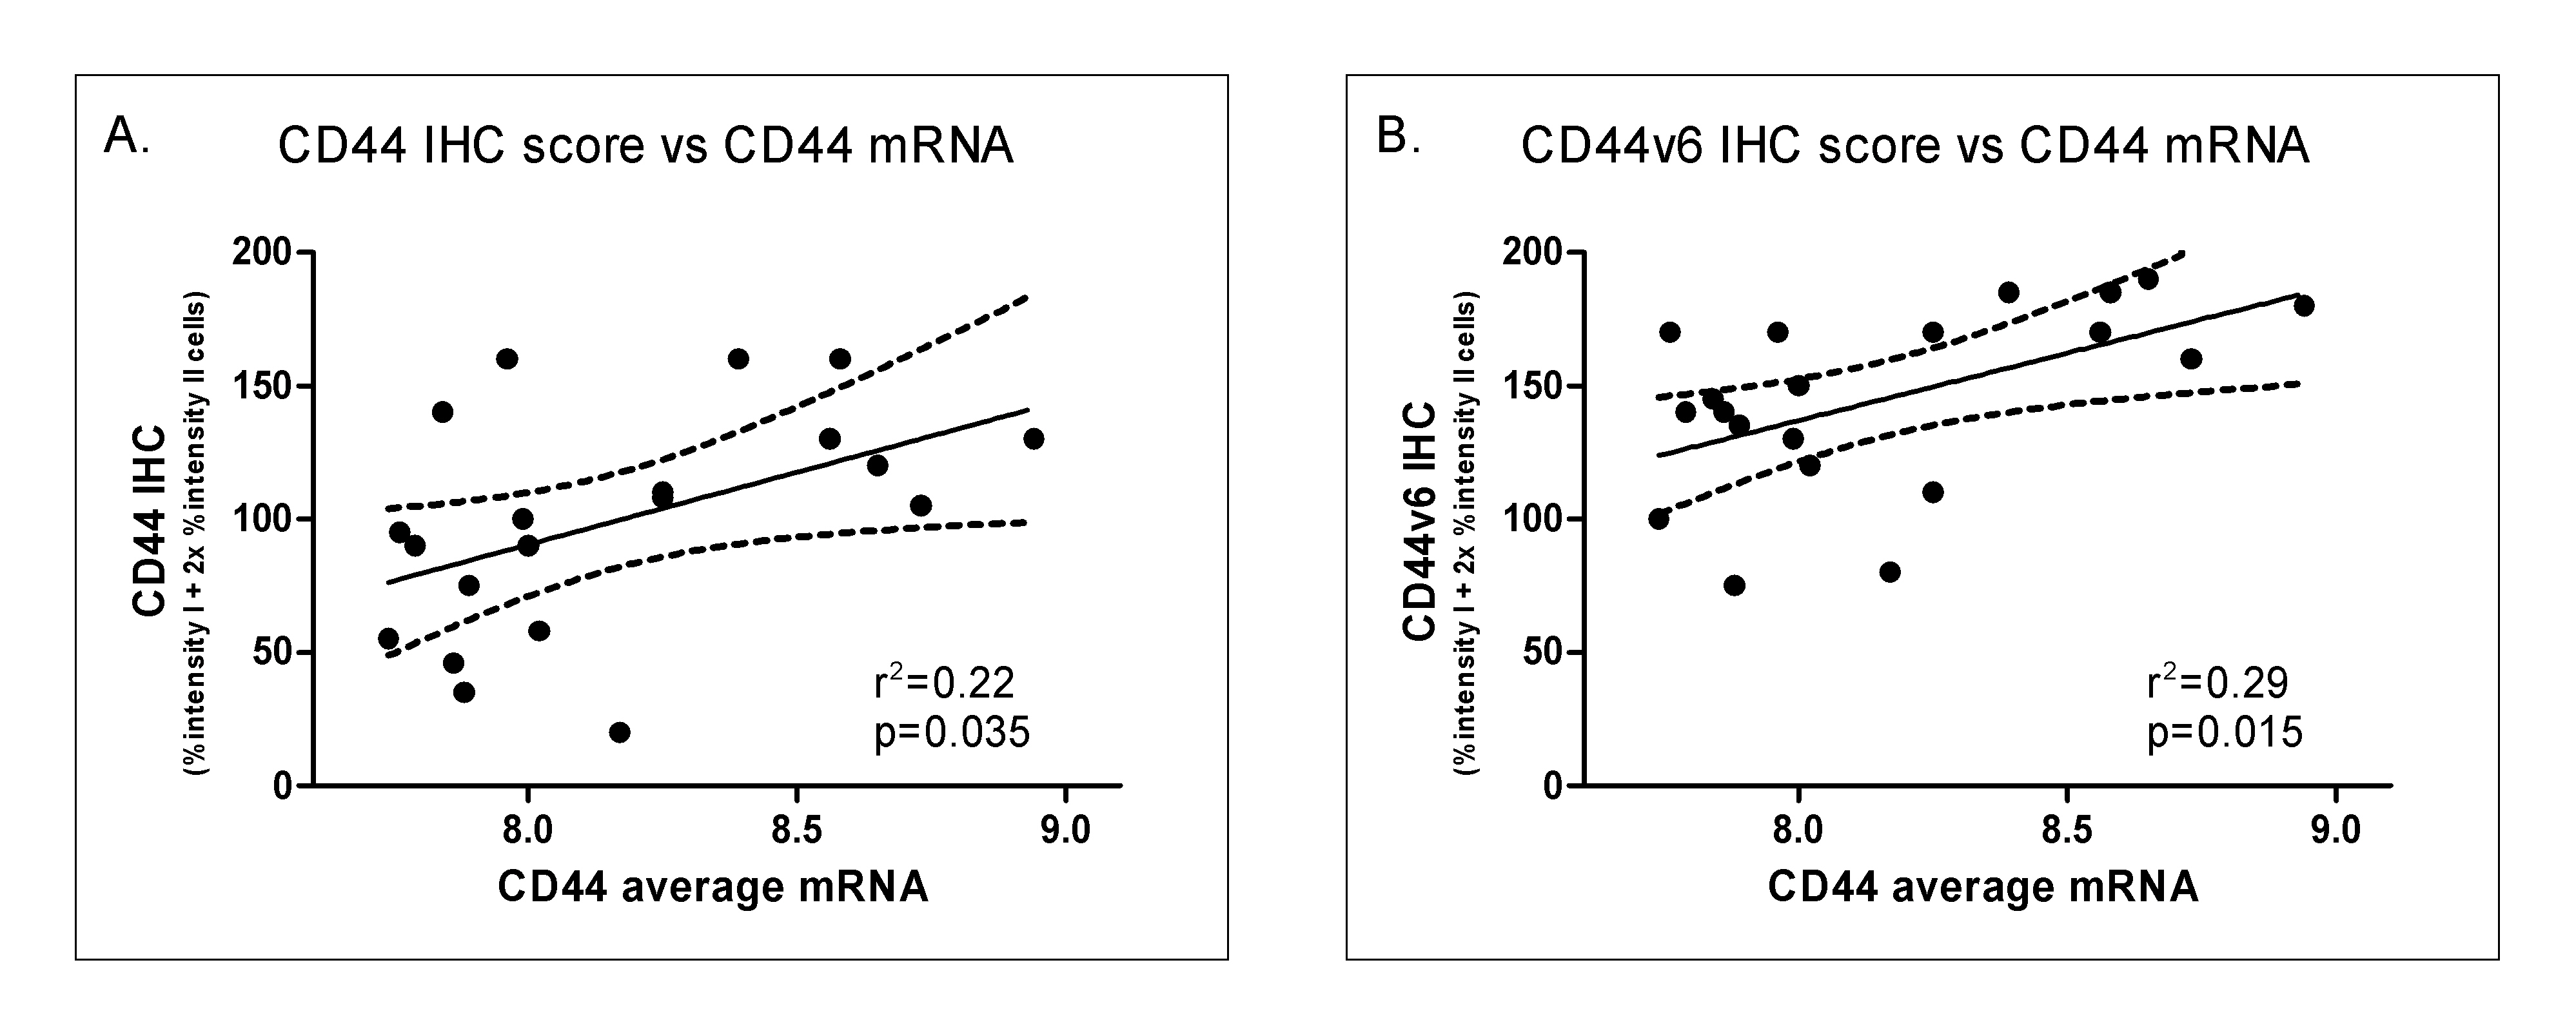
Figure 3.5. Correlation between mRNA expression and immunohistochemistry for CD44 (A) and CD44v6 staining (B). IHC: immunohistochemistry.
CD44 expression in the validation series.
We next tested whether immunohistochemical expression of CD44 correlated with clinical outcome. We used an independent matched series of laryngeal cancers with patient characteristics similar to the test series. Patient characteristics of this validation series, like the 52 patients in the test series, were predominantly male with a T1-2 glottic tumor and treated with radiotherapy alone (Table 3.2). CD44 expression, assessed immunohistochemically for percentage CD44-positive cells weighted according to staining intensity (see Materials and Methods), was significantly associated with clinical outcome. Histograms of the IHC scores showed higher CD44 protein expression in recurrences compared with cures (Figure 3.6A). As before, when patients were divided into three groups with low, medium and high CD44 expression, split to ensure equal numbers of recurrences per group, the odds ratio for recurrence was 6.1 fold higher in the highest group compared with the lowest (P = 0.005, Figure 3.6B). These data on protein expression thus confirm the mRNA expression data.
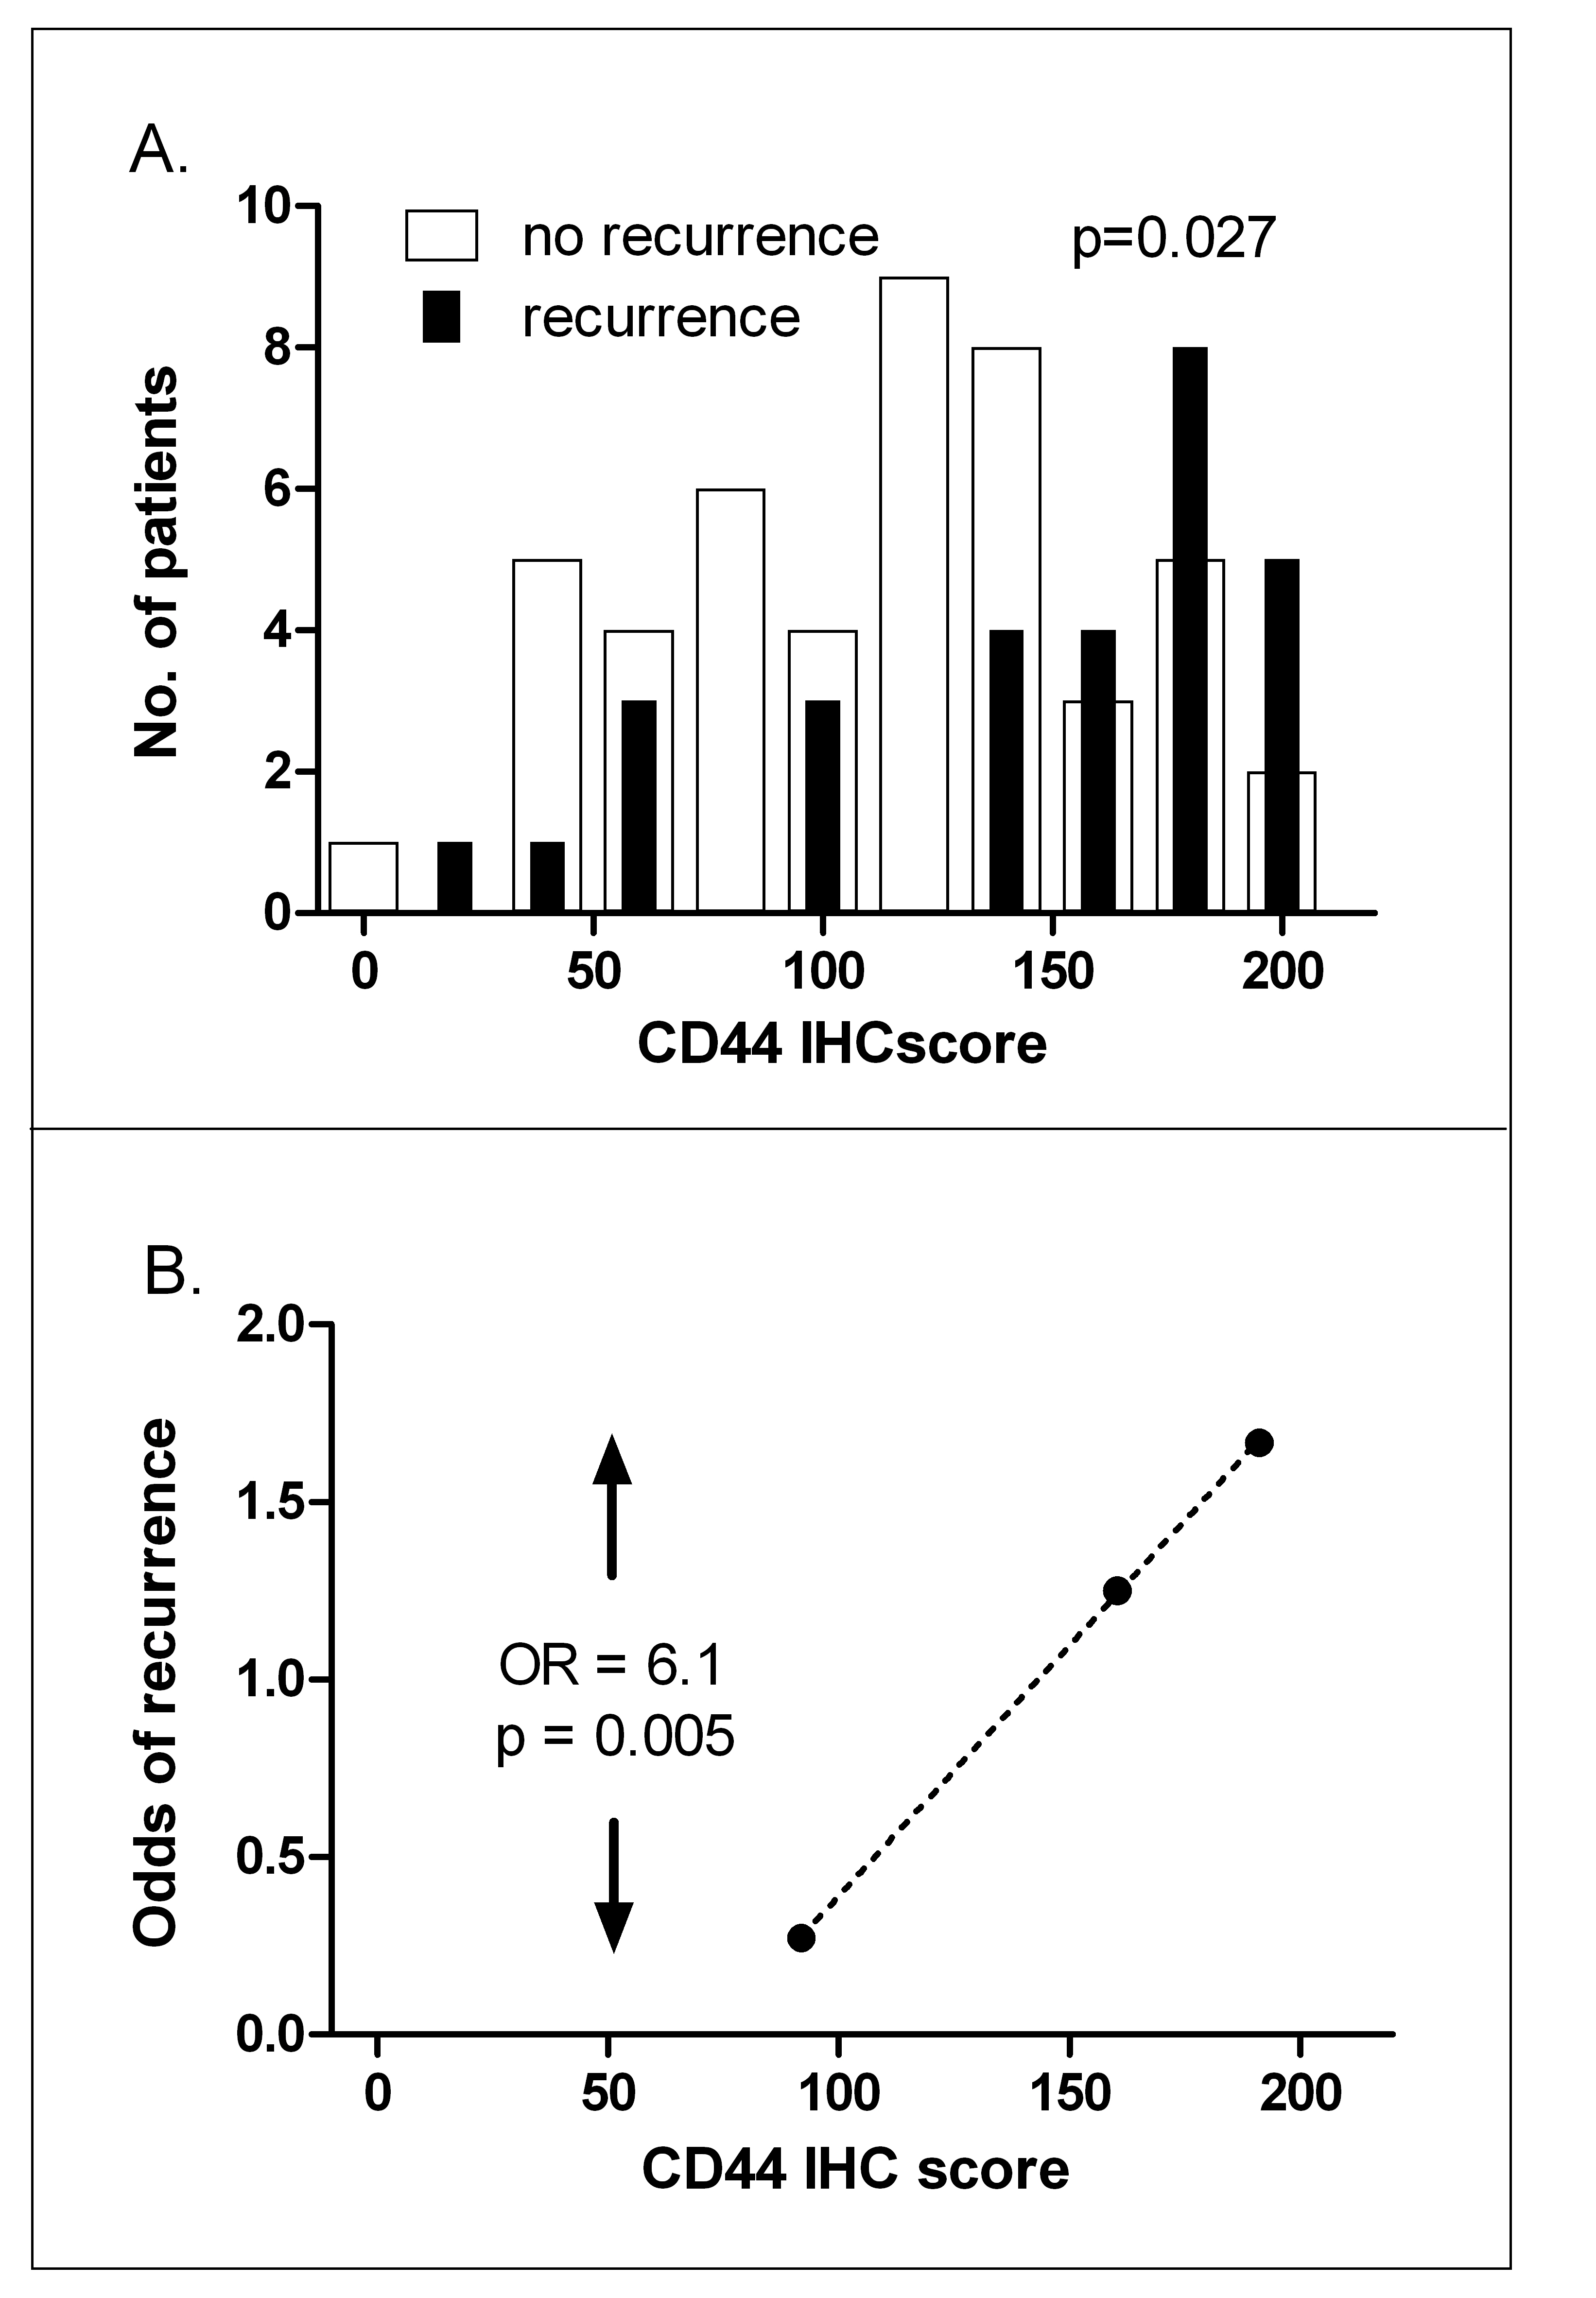
Figure 3.6. CD44 IHC predicts local recurrence. A, histograms of CD44 IHC score for patients subsequently cured (open bars) or those subsequently suffering a recurrence (closed bars). B, odds of recurrence when patients are divided into three groups with increasing IHC scores, split so that each group contains equal numbers of recurrences. OR: odds ratio of recurrence between highest and lowest CD44 expression groups.
Larynx cancer cell lines
In addition to cellular radiosensitivity, the effectiveness of fractionated radiotherapy can be determined by microenvironmental factors such as hypoxia, repopulation rates during therapy, and the fraction of stem cells. As a first step in attempting to dissect the role played by CD44 on these factors, we studied a series of larynx cancer cell lines under well controlled in vitro conditions. As shown in Figure 3.7, CD44 mRNA levels (average for the three probes) correlated significantly with plating efficiency (P = 0.03). Since plating efficiency has been correlated with tumor initiating capacity in several studies, this is consistent with CD44 being a stem cell marker in this tumor type. In the same experiments, CD44 expression did not correlate with intrinsic radiosensitivity in these 9 larynx cancer cell lines (P-value = 0.71). None of the three CD44 probes individually showed a correlation with radiosensitivity, while two out of three CD44 probes show a significant correlation with plating efficiency (Table 3.6). These data imply that CD44 expression is not monitoring intrinsic radiosensitivity but rather the fraction of stem cells.
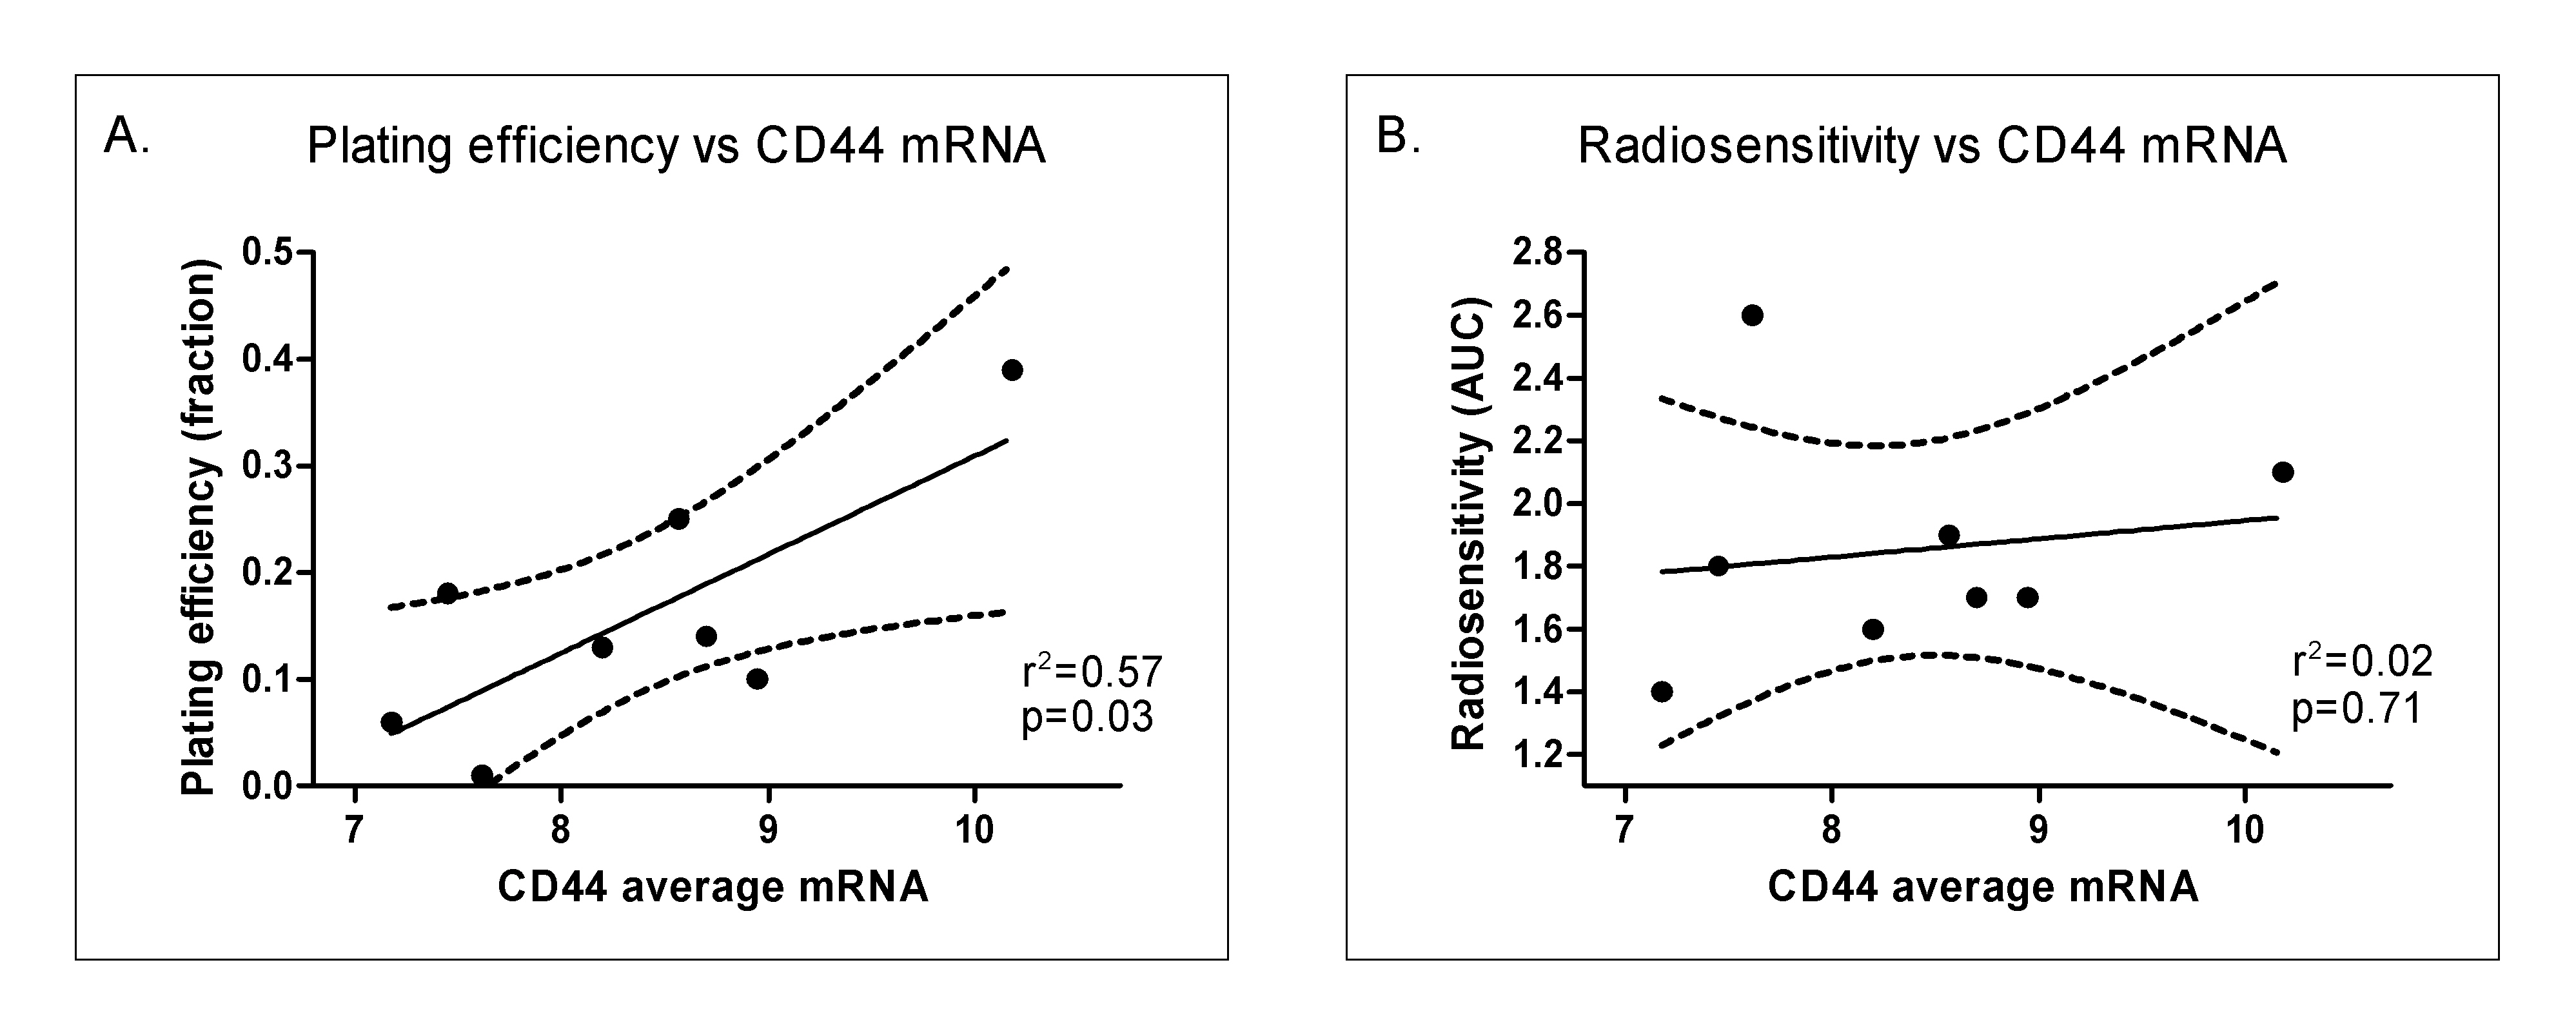
Figure 3.7. Correlation of plating efficiency (A) and radiosensitivity (B; as measured by area under the survival curve (AUC)) with CD44 mRNA levels (averaged over the 3 probes).
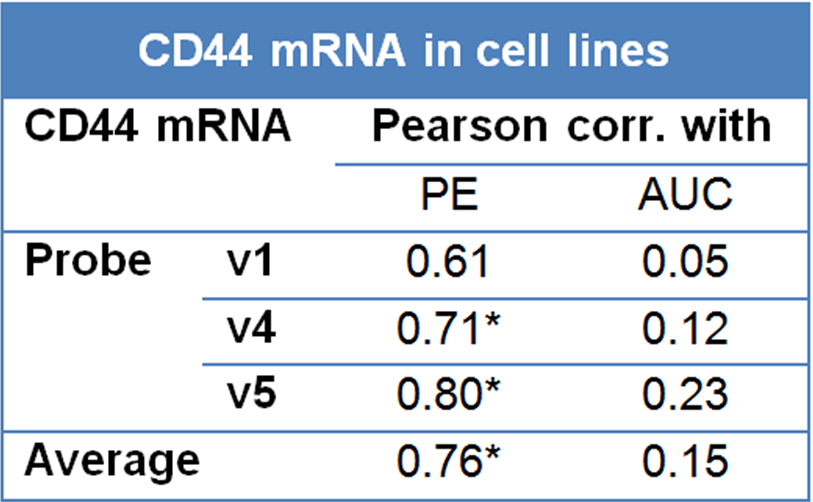
Table 3.6. Correlation of CD44 expression with plating efficiency (PE) and radiosensitivity (area under radiation survival curves, AUC). V1, v4 and v5 are three separate probes for CD44 mapping to exons 6, 18 and 18 respectively. *Significant at the 0.05 level (2-tailed).