Few overlapping genes in four different hypoxia gene sets
The four published gene sets for hypoxia that have been validated to predict outcome in head and neck cancer consisted of a total of 147 unique gene symbols. Of these gene symbols, 82% was only present in one of the four signatures, whereas 2% of the genes was present in all four signatures: ALDOA, P4HA1 and SLC2A1 (figure 5.1). Aldolase A is a glycolytic enzyme, the P4HA1 gene encodes a component of a key enzyme in collagen synthesis and the SLC2A1 (a.k.a. GLUT-1) gene encodes a glucose transporter.
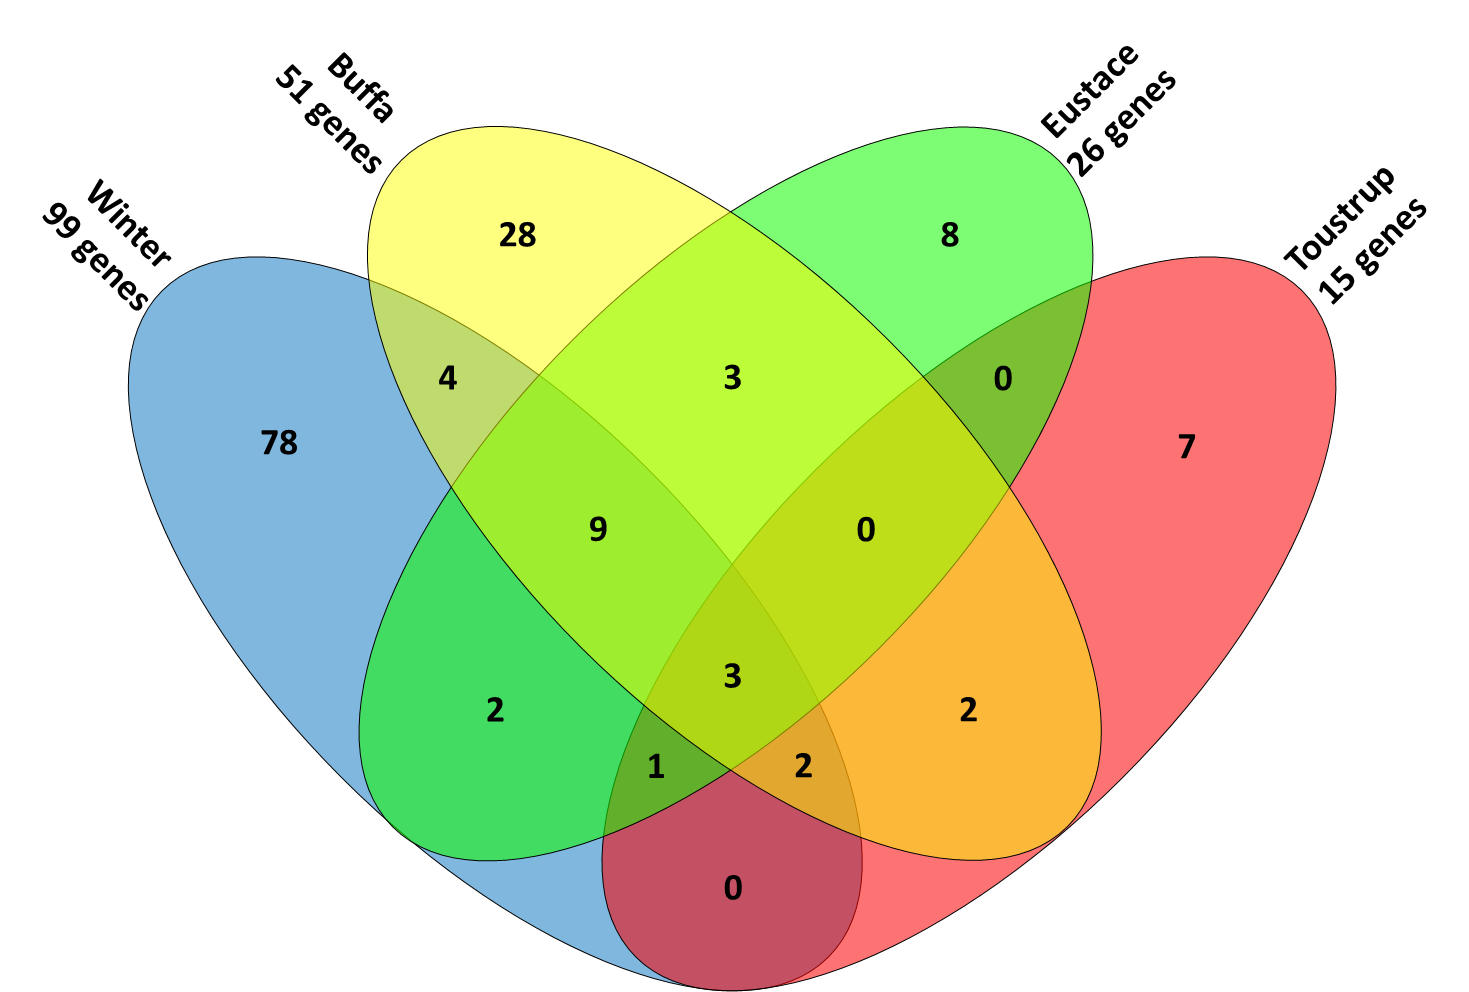
Figure 5.1. Four-way Venn diagram showing the overlapping genes in the 4 different signatures.
Classification of patients using four different hypoxia gene sets is nearly identical
Every tumor was ranked between 0 and 1 for each signature, representing the average expression of the genes in the different signatures. Scores between different signatures could then be compared, based on their classification of the 224 patients. As can be observed in figure 5.2, the average Spearman correlation between scores assigned by the different signatures was highly significant, with an average correlation of 0.82 (range 0.71-0.90, all p-values < 0.0001). This indicates that the four signatures rank patients in an almost identical manner.
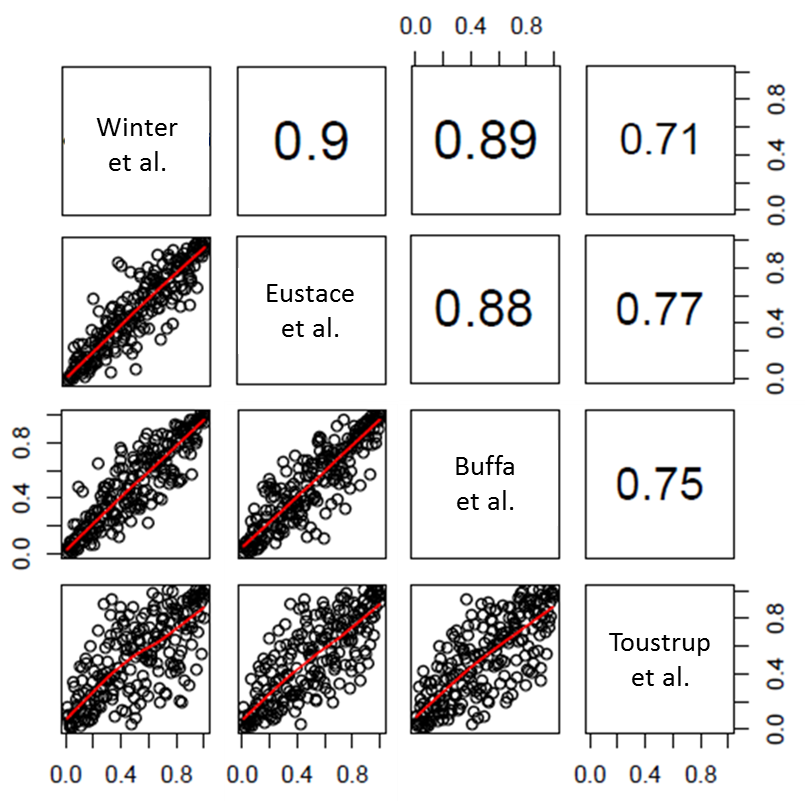
Figure 5.2. Spearman correlations (upper right panels) and scatterplots (lower left panels) of all possible pairs of hypoxia signatures for 224 patients. All Spearman correlations were significant at the p < 0.0001 level.
Published hypoxia gene sets resemble in vitro chronic hypoxia response
Scores for the four published gene sets and four in vitro hypoxia gene sets (early and late response to 0% and 2% oxygen) were generated for all 224 patients. The average Spearman correlations between the scores for the published profiles and late-0% or late-2% O2 response profiles were 0.60 and 0.49 respectively (both p<0.0001). The average correlations with early response were -0.09 (p=0.2) and 0.23 (p<0.001) for early-0% and early-2% O2 respectively. All correlations and the corresponding scatterplots can be seen in figure 5.3.
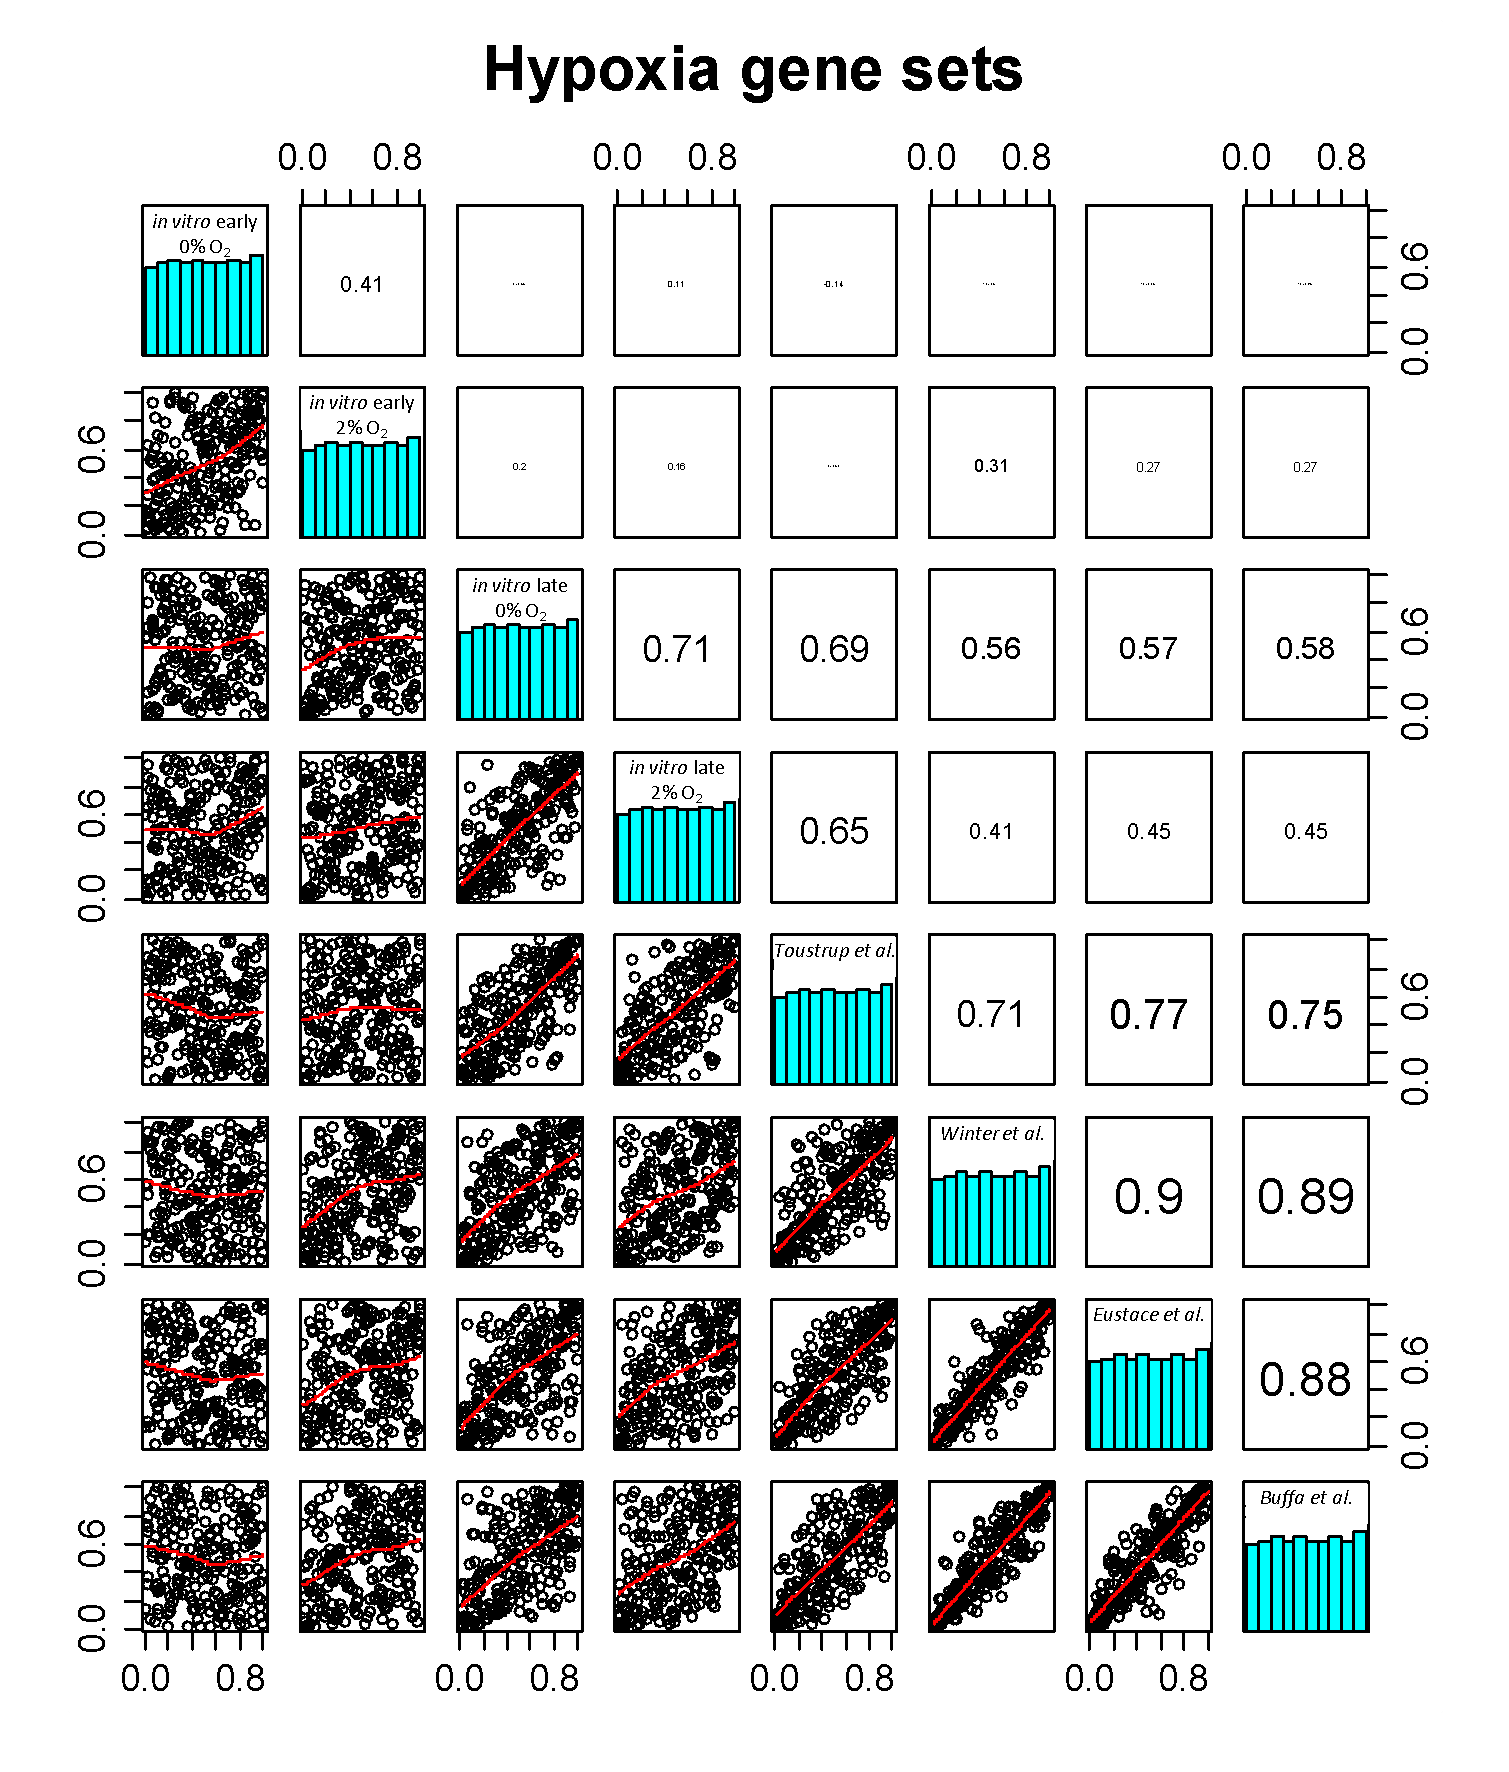
Figure 5.3. Correlation of all published and in vitro hypoxia profiles: Spearman correlations (upper right panels), histograms of the normalized (0-1) scores for the signatures (diagonal panels) and scatterplots (lower left panels) of all possible pairs of hypoxia signatures for 224 patients. The printed size of the Spearman correlations is a representation of the actual absolute size of the correlation.
A clustering of the scores for the 224 patients can be seen in figure 5.4. The dendogram to the left of the heatmap shows that, again, the four published gene sets clustered together. Interestingly, the two in vitro profiles of late response to hypoxia clustered with these published profiles (cluster 1), whereas no correlation was observed with the in vitro profiles of early response to hypoxia (cluster 2).
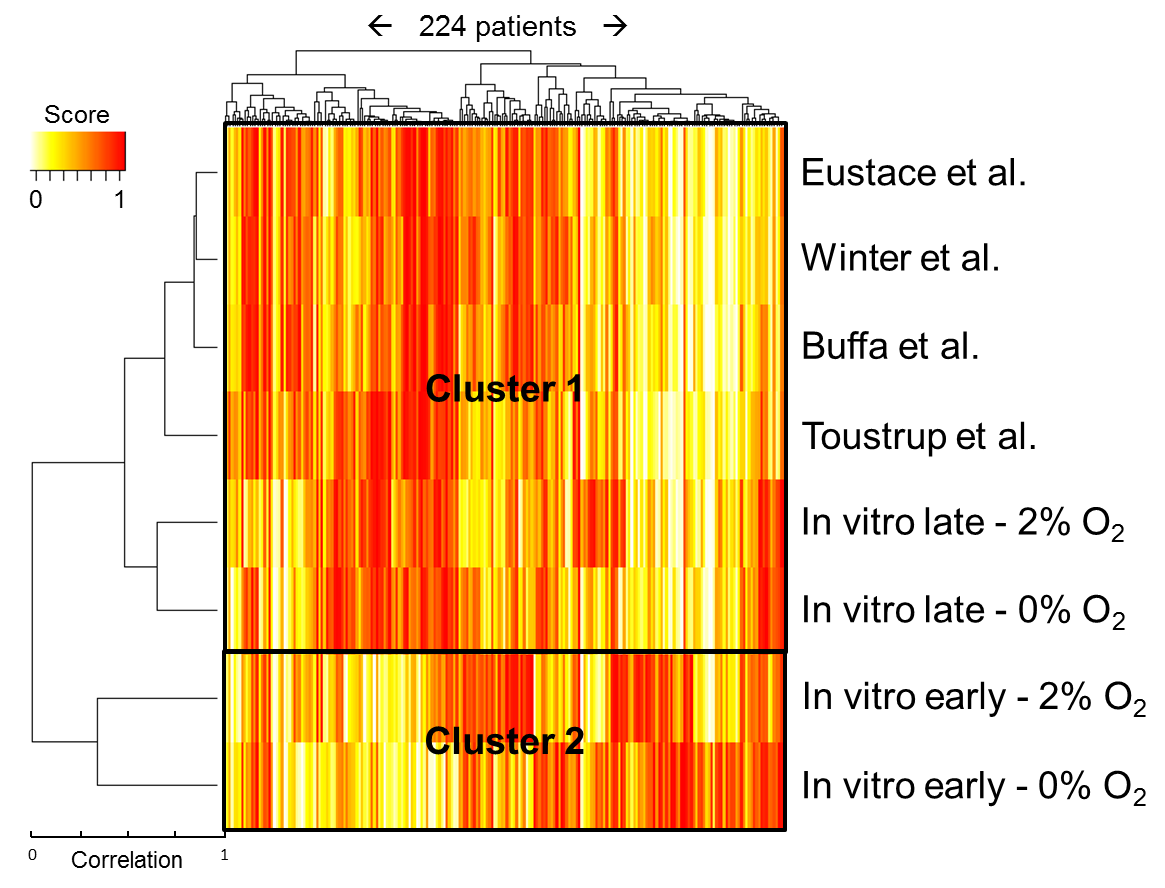
Figure 5.4. Heatmap showing the scores for the expression of different genes/gene sets in 224 patients.
In vitro early hypoxia response profile predicts recurrence in 91 chemoradiotherapy patients
The predictive value of the different hypoxia profiles on local recurrence rate after therapy was tested on the 91 chemoradiotherapy patients. Per gene signature, patients were divided into two groups by the median rank. Kaplan-Meier statistics were used to assess the difference in recurrence free survival between the two groups. Of the four published and four in vitro gene sets, only the ‘in vitro early 0% O2‘ set showed a significant difference (log rank p-value = 0.02) between high and low expression: patients with a low expression of in vitro early hypoxia genes had a lower recurrence percentage with a hazard ratio of 3.1 (95%CI: 1.1−8.6). Curves and hazard ratio’s for all signatures can be seen in Supplementary figure 5.1. Since scores for the 4 published profiles and the two late in vitro profiles were similar, they were averaged per patient to obtain a joint chronic hypoxia score. These average scores indicated that low expression of chronic hypoxia genes tends to give a better recurrence free survival (HR=1.8, 95%CI: 0.69-4.5, p=0.2, Kaplan-Meier curves in Supplementary figure 5.2). In this analysis the effect was not significant. To learn whether the effects of the acute and joint chronic hypoxia signatures were independent, a crosstab was made showing local recurrence percentages for high and low acute and chronic hypoxia (figure 5.5). High and low expressors were defined as above or below the median expression for the whole group.
Next, a Kaplan-Meier curve was made for three groups: low acute and chronic hypoxia, high acute or high chronic hypoxia and high acute and chronic hypoxia (figure 5.5). The curves and the crosstab in figure 5.5 show that when both acute and chronic hypoxia expression scores were low, the chance of tumor recurrence was far lower than when both were high.

Figure 5.5. Kaplan-Meier curve of freedom from local recurrence for 3 groups: low acute and chronic hypoxia, high acute or high chronic hypoxia and high acute and chronic hypoxia. Crosstab of local recurrence percentage per subgroup in 91 chemoradiotherapy patients. Definition of chronic hypoxia: the average of scores for late 0% and 2% hypoxia, Toustrup et al, Winter et al, Eustace et al and Buffa et al gene sets. Samples were divided into two groups using the median. Cells are colored in a color corresponding with the line color in the Kaplan-Meier curve.