All studies reported here were done with approval of the local Medical Ethics Committees.
Gene expression series
Patients.
Fifty two patients were recruited from five different institutes in The Netherlands and were eligible if they had been treated for a T1 or T2 larynx carcinoma (Table 3.1), and pre-treatment fresh frozen tumor material was available. Patients were treated between 1997 and 2005, and staging was done either clinically or with a CT-scan. Because patients with small tumors did not have a CT-scan, tumor volumes could not be measured for the whole group. Treatment was radiotherapy alone with curative intent, applying fractionation schemes standard in each of the five centers. To compare different radiotherapy schedules, the equivalent dose in 2-Gy fractions (EQD2) was calculated for every patient with the formula: EQD2 = D × (d + α/β)/(2 + α/β), where D is the total dose, d the given fraction dose, the α/β ratio was assumed to be 10 Gy. Recurrence was defined as a histologically proven local tumor recurrence within two years of the initial treatment, to ensure the analysis of true recurrences rather than second primaries. Since we planned to study a matched series, for every patient with a recurrence we aimed to include two controls, with a recurrence-free follow-up of at least two years and matched for the institute they were treated in, T-stage, subsite, gender and age. There were no significant differences between groups with and without local recurrence in age, gender, subsite, T-stage, total dose, fraction size, tumor percentage or RNA quality (Table 3.1).
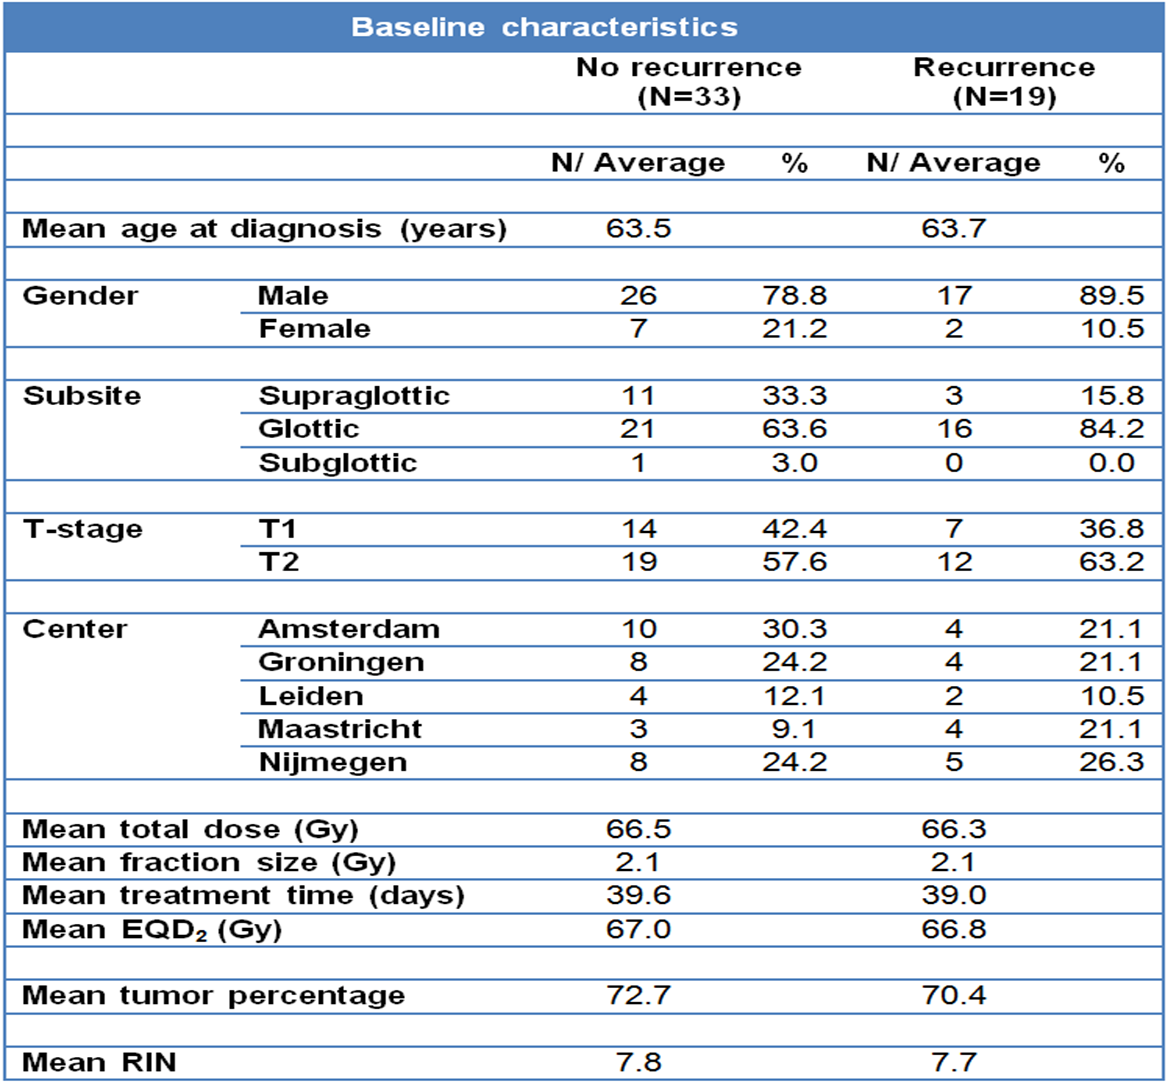
Table 3.1. Baseline characteristics of patients and treatments in the expression profiling test series: The characteristics are shown separately for the groups with and without recurrences. EQD2: dose recalculated to an equivalent dose in 2 Gy fractions. Tumor percentage: average percentage of tumor cells in the frozen biopsy used for RNA extraction. RIN: RNA integrity number.
RNA isolation.
All biopsies were snap frozen in liquid nitrogen. Around 30 slices of 30 μm were deposited in RNA-Bee (Campro scientific). Before and after these 30 slices H&E sections were taken that were subsequently assessed by an experienced pathologist, who scored differentiation and tumor percentage. Only biopsies containing on average more than 50% of tumor cells were included. The tumor material in RNA-Bee was processed using the Qiagen RNeasy mini and RNase-free DNase kits. Total RNA was isolated and DNAse treated using spin columns according to the manufacturers instructions. The Agilent 2100 bioanalyzer was used to assess the integrity (intactness) of the RNA. Samples with an RNA Integrity Number (RIN) under 6.0 or with no obvious 18S and 28S peaks were discarded.
Gene expression.
cDNA was made from one microgram of total RNA and amplified into aRNA with T7-mRNA Superscript-III amplification kit (Invitrogen). Only amplification yields over 1000-fold with a 1 kB smear on a gel were accepted. Hybridization to microarray slides was performed at our Central Microarray Facility (http://microarrays.nki.nl). All samples were hybridized to Illumina bead arrays (v3 Illumina beads) and subsequently scanned using the Illumina scanner. Each Illumina array consists of 3-micron silica beads covered with oligos containing over 48,000 transcript probes per sample, representing around 25,000 known genes. Each transcript probe was represented more than 20-fold per array and final data were averaged for each probe. Fluorescence intensities were measured with the Illumina scanner and averaged per probe.
Data analysis.
The dataset was transformed (variance stabilizing method (ref. 27)) and normalized (robust spline method) with the Lumi (28) package for R, version 2.8 (29) (http://www.R-project.org). If, for a specific probe, no patient had a value above background levels, that probe was filtered out. Gene sets for hypoxia, proliferation, radiosensitivity and stem cells were tested (13–16, 18, 30, 31). Unigene identifiers were used to map the genes in a set to the annotations of the Illumina array. For gene sets with known weights contributing to the endpoint (as described in the original publications), Pearson correlations were calculated against the weights of a gene set for each patient. This also allowed assessment of gene sets which included genes both positively and negatively correlating with outcome. For gene sets without weights (each gene assumed to contribute equally), the average expression of the genes in the set was calculated. For these signatures, all genes in the set were correlated in the same direction with outcome. The Pearson or average values were then used in a logistic regression with local recurrence data. In order to give comparable odds ratios, some Pearson correlations were multiplied by 5 or 10, which does not change the P-values but simply provides a better comparison of odds.
In addition to this hypothesis-driven analysis, a data-driven analysis was performed with Biometric Research Branch (BRB) array tools (NIH, http://linus.nci.nih.gov/brb-arraytools.htm). Genes were first filtered by including probes where at least 20% of samples had a minimum fold change greater than 1.35 and a P-value for log-ratio variation under 0.01. The filtered set was entered in a nearest centroid model that finds genes that best predict local recurrence. Genes significantly different between the patients with and without recurrence at the P < 0.01 significance level were used for class prediction. The leave-one-out cross-validation method was used to compute mis-classification rates.
Immunohistochemistry series
Patients.
Of the patients included in the mRNA expression microarray series, paraffin embedded material for immunohistochemistry (IHC) was used from two of the five institutes (Amsterdam and Groningen). This small subset of 20 cases was used to confirm gene expression values by IHC. A second matched series of 76 patients was used as an independent validation series of our findings from the gene expression study. Paraffin embedded biopsies were used to make cores for a tissue microarray (TMA). The construction of the TMA and the patient characteristics were described previously (10). Briefly, the patients were predominantly male with stage T1 and T2 glottic tumors given a median of 66 Gy in 2 Gy fractions (Table 3.2).
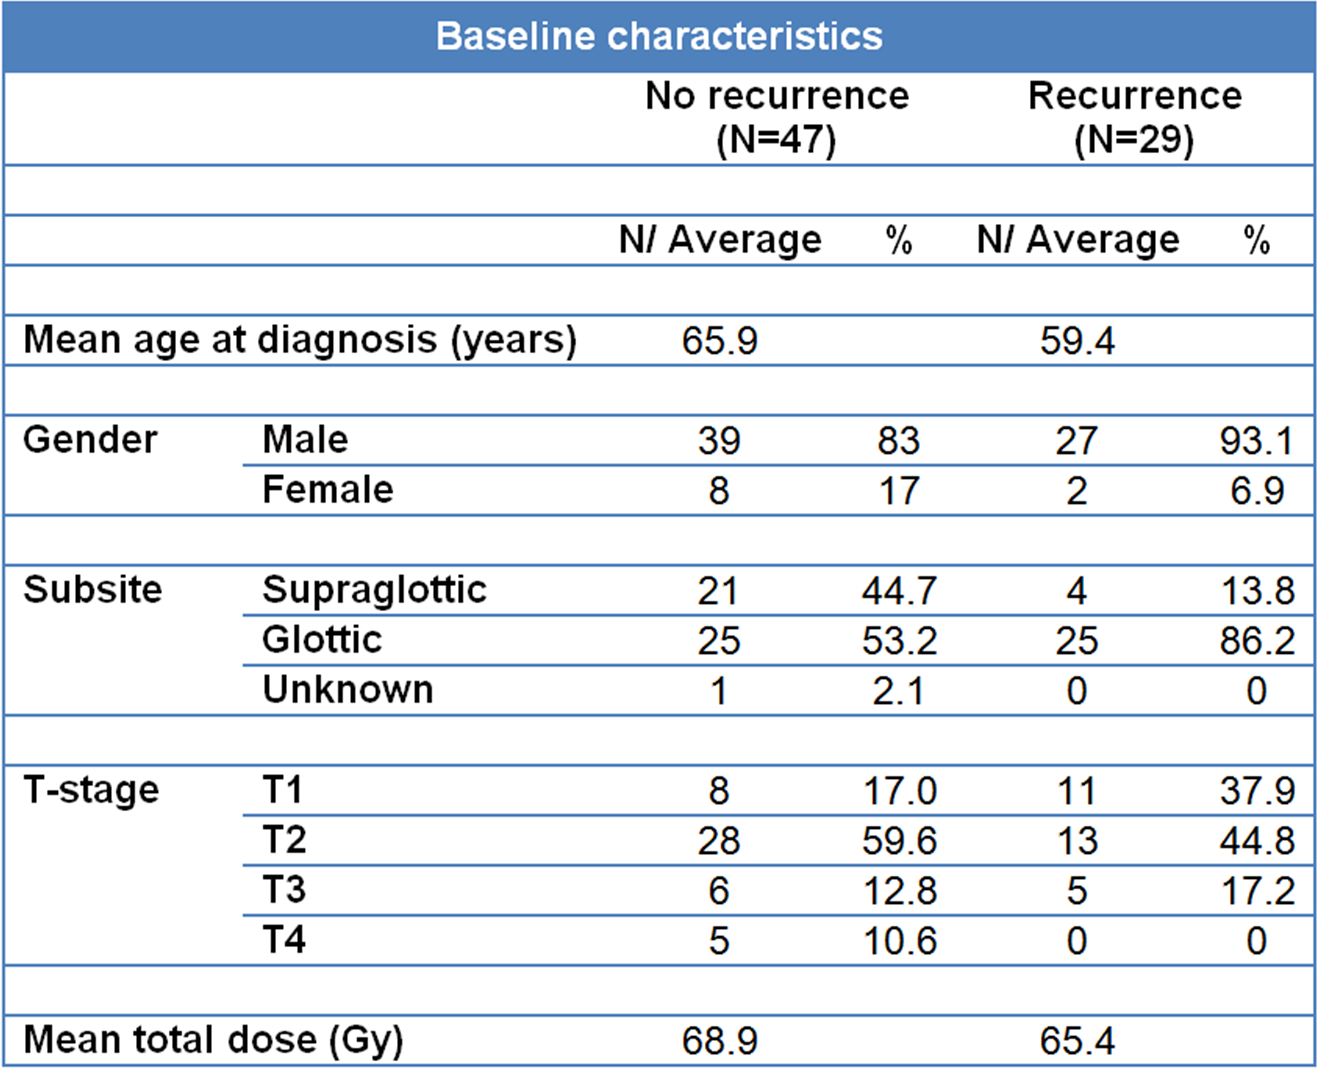
Table 3.2. Baseline characteristics of patients in the TMA validation series: The characteristics are shown separately for the groups with and without recurrences.
Immunohistochemistry staining.
Sections of 3 μm were cut from either whole tissue blocks or the TMA and mounted on amino-propyl-ethoxy-silan (APES, Sigma-Aldrich, Diesenhofen Germany)-coated glass slides. Slides were deparaffinized in xylene and rehydrated in ethanol. Antigen retrieval comprised boiling the slides in a microwave oven in citrate (pH 6.0) for 15 minutes. Endogenous peroxidase was blocked with 0.3% hydrogen peroxidase for 30 minutes. Slides were incubated with a mouse monoclonal antibodies against CD44 (156-3C11; dilution 1:200; Cell Signaling Technology, Danvers, MA) and CD44v6 (clone VFF-18; dilution 1:8000; Bender Medsystems, Vienna, Austria) for 1 h at room temperature. Detection was performed with RAMHRP (dilution 1:100) and GARHRP (dilution 1:100), visualized by 3′3-diaminobenzidinetetra-hydrochloride and counterstained with haematoxylin.
Immunohistochemistry scoring.
The percentage of tumor cells staining positive for CD44 was scored as well as the intensity of staining (low or high). A CD44 staining score was calculated by adding the percentages of positive low and high intensity cells, weighted by factor of 1 and 2 respectively. This weighted score reflects total CD44 protein better than total percentage positive cells, for better comparison with total mRNA from the microarray analysis. For the set of patients in which concordance between mRNA and IHC was tested, all slides were analyzed independently by two teams, each consisting of a pathologist (MvV and JvdW) and a scientist. Slides scored differently by the two teams were discussed at a conference microscope to reach consensus. Before consensus, the inter-observer correlation for CD44 scores was 0.75 (P < 0.001; Figure 3.1). For the TMA series of 76 patients, scoring was done by one team. Pearson correlations were calculated between mRNA levels and IHC scores. For the TMA analysis, associations between CD44 expression and local recurrence were compared using a logistic regression model. P-values of <0.05 were considered statistically significant. Statistical analysis was performed with SPSS 16.0 for Windows (SPSS Inc., Chicago, IL).
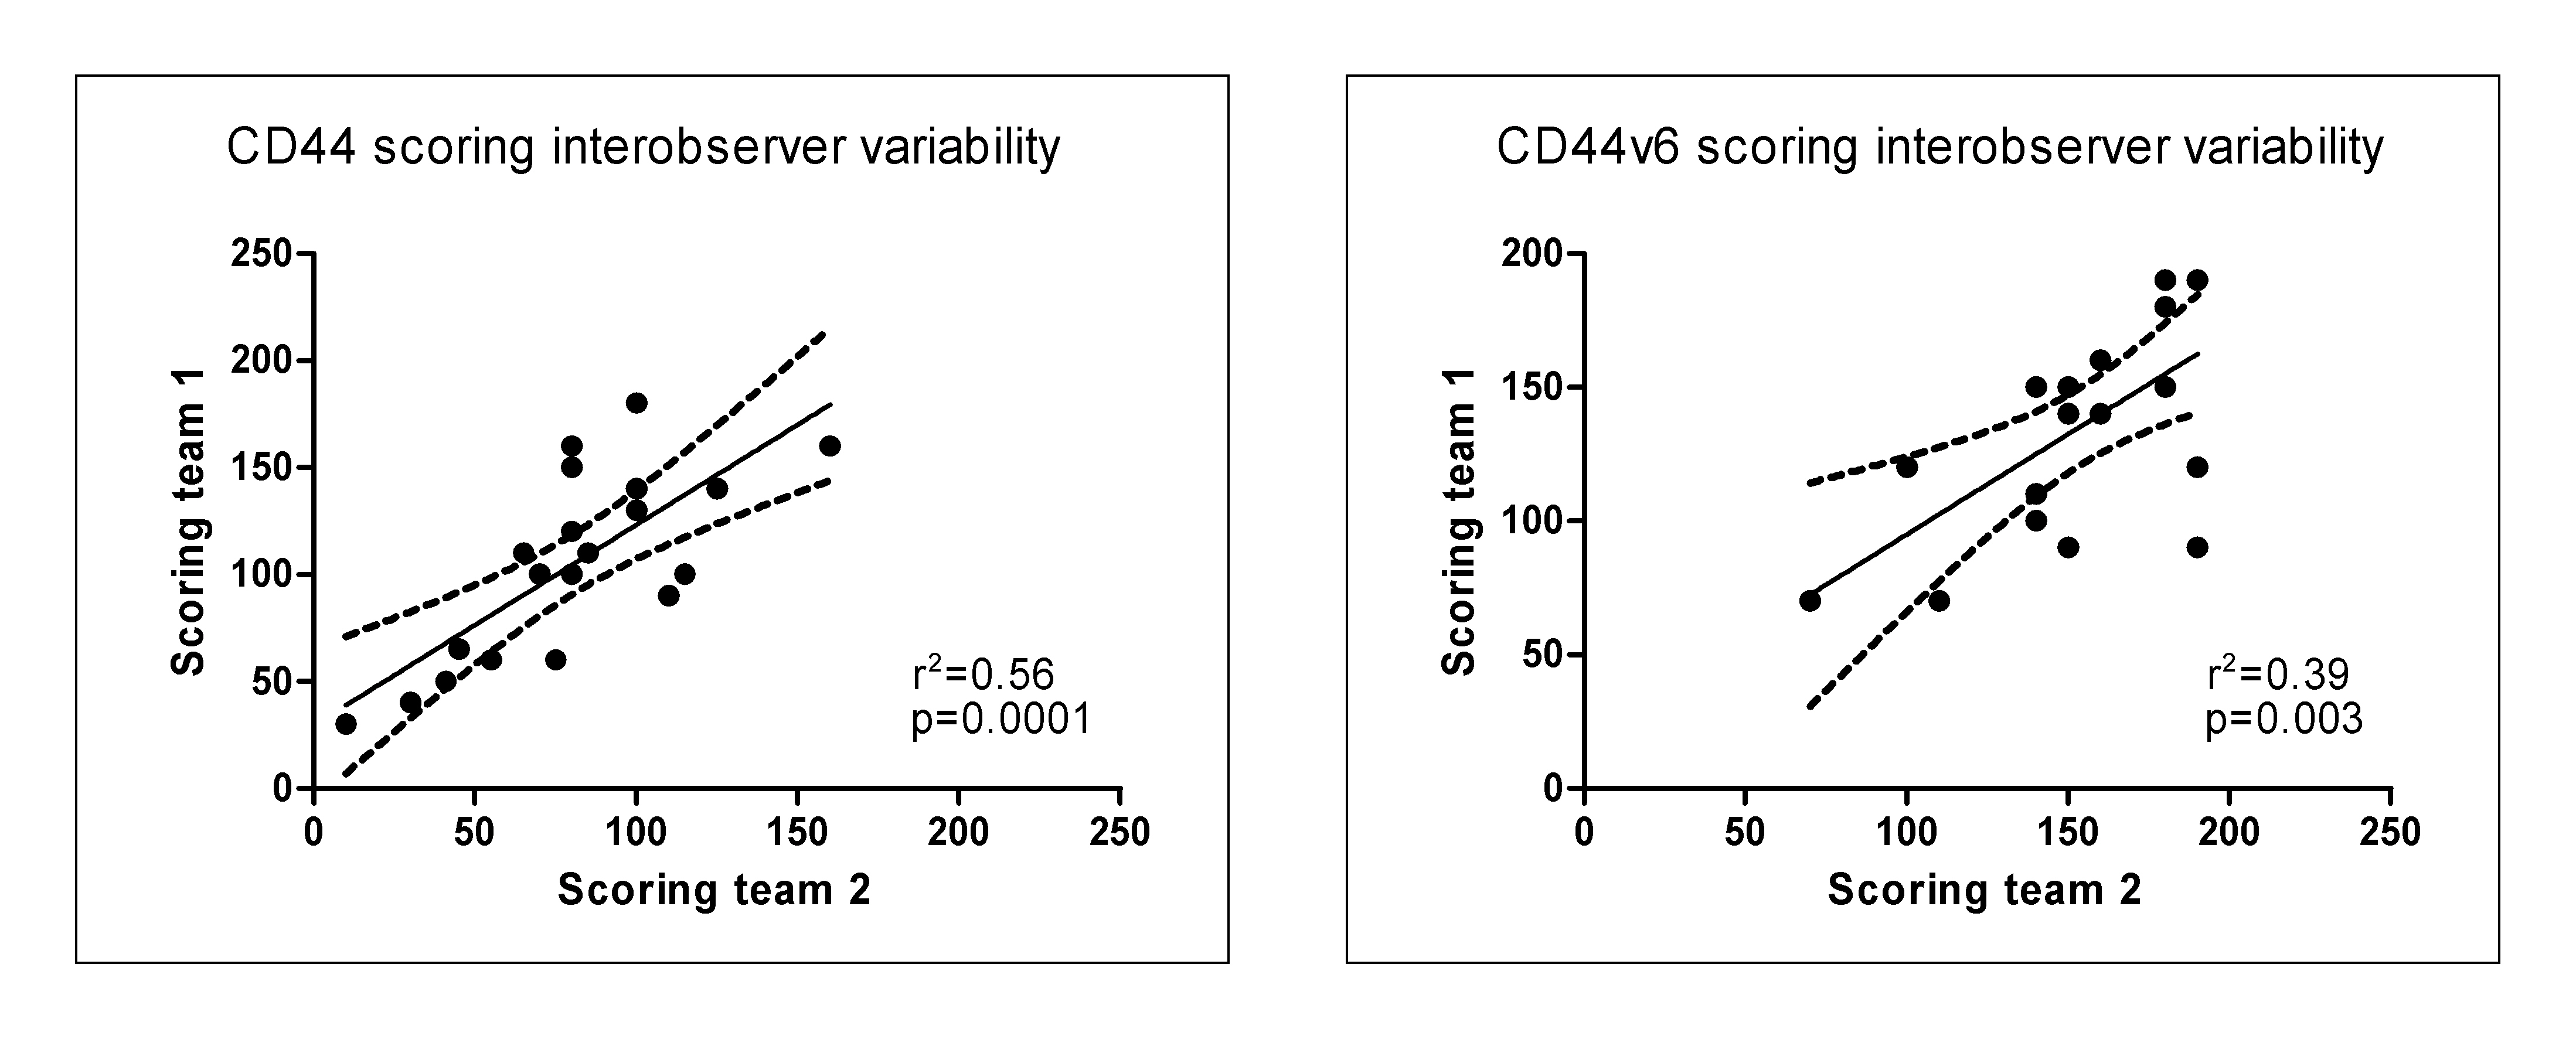
Figure 3.1. Interobserver variability between immunohistochemistry scores of the two teams for N=20.
Larynx cancer cell lines
Cell culture.
The larynx cancer cell lines UT-SCC-6A, -8, -9, -19A, -19B, -22, -23 and -42A from the University of Turku (Finland) were cultured in DMEM with 10% FBS, 1% NEAA, 1% L-glutamine and 1% penicillin-streptomycin. Information was available on plating efficiency and radiosensitivity for all cell lines (published and unpublished data) (refs. 32–34).
Gene expression.
For each cell line, 1 × 10⁶ cells were washed with ice cold PBS at approximately 50% confluence and then collected in RNA-Bee. Illumina microarray data were generated using the same methods and materials as described above for the tumor biopsies.