Patient inclusion
Of 92 patients, 75 were eligible for analysis in the current series. A total of 17 patients were excluded from further analysis for the following reasons: 10 patients had a T1-2 or larynx tumor, 1 patient was a double entry, 1 patient had a volume of nearly 400 cc, more than 4 times higher than the next largest tumor, and was therefore not considered to be representative of the group, and 5 patients had a poor quality CT scan and therefore no volume data could be obtained. Tumor volume was measured on MRI scans for 64 patients and on CT-scans for 11 patients.
Patient characteristics
The characteristics of the patients are shown in table 2.2. The study population was predominantly male (69%) with a mean age at diagnosis of 58 years. Patients had a pharynx tumor (oropharynx and hypopharynx combined) in 85% and a tumor of the oral cavity in 15%. The mean primary tumor volume was 30.9 cc, ranging from 4.3 cc to 96.7 cc. Patients received radiotherapy with i.a. cisplatin (34 patients), high dose i.v. (18 patients) or low dose i.v. (23 patients) cisplatin treatment. For the Chung status, 64% of the patients were predicted to be low risk and 36% high risk. Since the median average expression for the Slebos HPV genes was used to generate two groups, half of the patients had a positive profile. Median follow-up time was 93 weeks. A total of 17 local recurrences occurred during follow-up, with a median time to recurrence of 24 weeks.
Table 2.2. Patient characteristics: Baseline characteristics of the 75 patients that were included in this study.
Univariate analysis
Of all factors included in the univariate analysis, significant predictors of local recurrence were Chung status, tumor site and HPV profile (table 2.3). Kaplan Meier curves for local recurrence for these factors are shown in figure 2.1. There was no significant difference between hypo- and oropharynx tumors, and so these were combined into one group of pharyngeal carcinomas. Associations with age at diagnosis, T-stage and tumor volume were suggestive, but did not reach statistical significance (p<0.05). Oral cavity tumors, a Chung high risk profile and a negative HPV profile were significantly associated with a higher risk of local recurrence.
Table 2.3. Univariate and multivariate analysis – local recurrence: Results of the univariate Cox proportional hazards analysis for all factors. The hazard ratio (HR) between the two categories of each factor is given, together with the p-value and, if applicable, a p-value for the trend of the corresponding continuous variable. Results of the multivariate Cox proportional hazards analysis for the five factors with a HR>1.5 or <0.5 or a p-value<0.05 in the univariate model.
Figure 2.1. Site, Chung and HPV profile: Kaplan-Meier curves for all 75 patients grouped by based on site (A), Chung risk group (B) and HPV profile status (C). The given p-values were calculated with a log-rank test.
Multivariate analysis
Of the six factors entered in a multivariate Cox regression, tumor site, Chung status and HPV status were significantly associated with local control (table 2.3). Patients with oral cavity tumors were 4 times as likely to get a local recurrence compared to patients with a pharynx tumor (HR 4.2, 95% CI 1.4 – 12.5). Risk for local recurrence was increased at a similar magnitude for patients with a Chung high risk signature compared with the low risk group (HR 4.4, 95% CI 1.5 –13.3). Patients with a HPV-negative profile were 6 times more likely to get a local recurrence than patients with a HPV-positive profile (HR 6.2, 95% CI 1.7 – 22.5).
Local recurrence by number of risk factors
Figure 2.2 shows a Kaplan-Meier curve for a combined model of site, Chung status and HPV status. The number of unfavorable features (an oral cavity tumor, a Chung high risk profile and a HPV-negative profile) were added up for every patient. For example, a patient with a tumor of the pharynx with a Chung low risk profile and a HPV-positive profile has 0 high risk features. From this figure can be seen that in the group of 22 patients with just favorable factors (0) there were no recurrences during follow up and the 4 patients with three unfavorable factors all had recurrences.
Figure 2.2. Local recurrence by number of risk factors: Kaplan-Meier curve for all 75 patients organized into groups based on the number of high risk features (Chung high risk profile, HPV profile negative and oral cavity). The given p-value was calculated with a log-rank test.
Comparison with a larger series
In line with the results for the series of 360 patients [21], site and, to a lesser degree, T-stage were important predictors of local control. Tumor volume was not significantly associated with local control in the univariate analysis in the current study, whereas the association was highly significant in the earlier published larger series of 360 patients (p<0.001) [21] from which the present patient population was taken. However, the magnitude of the association was approximately similar, but was attenuated in the multivariate analysis of the current data. We explored the dependence of the strength of association on sample size by drawing ten random samples of 75 patients from the series of 360 patients (table 2.4). Tumor volume was significantly associated with local control in 5 of the 10 samples, and 3 of the 10 corresponding p-values exceeded the one observed in the current smaller series. The differences observed for tumor volume is therefore likely due to the smaller size of our current series. In addition, it is possible that the Chung or HPV profiles partly capture the tumor volume signal in the multivariate analysis.
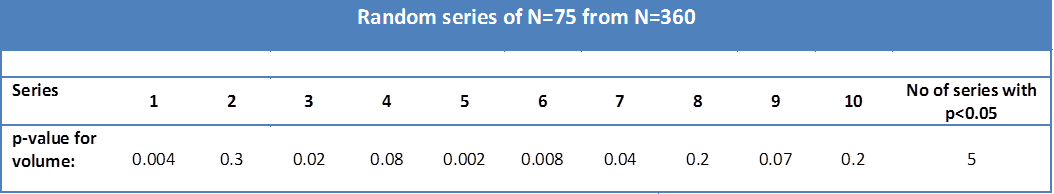
Table 2.4. Random series of N=75 from N=360: Ten series of 75 patients, all randomly selected from a larger series of 360 patients. Five of the ten randomly generated series had a p-value<0.05 for tumor volume in a cox proportional hazards model.