Cell line selection and culture
Cell line selection.
All cell lines for hypothesis generation were obtained from Professor R. Grénman (University of Turku, Turku, Finland), who has a unique panel of more than 100 well-characterized HNSCC cell lines with known radiosensitivity. We selected 32 HNSCC cell lines from different subsites (Table 4.1). Cell lines previously treated with chemotherapy or derived from metastatic sites other than regional lymph nodes were excluded.
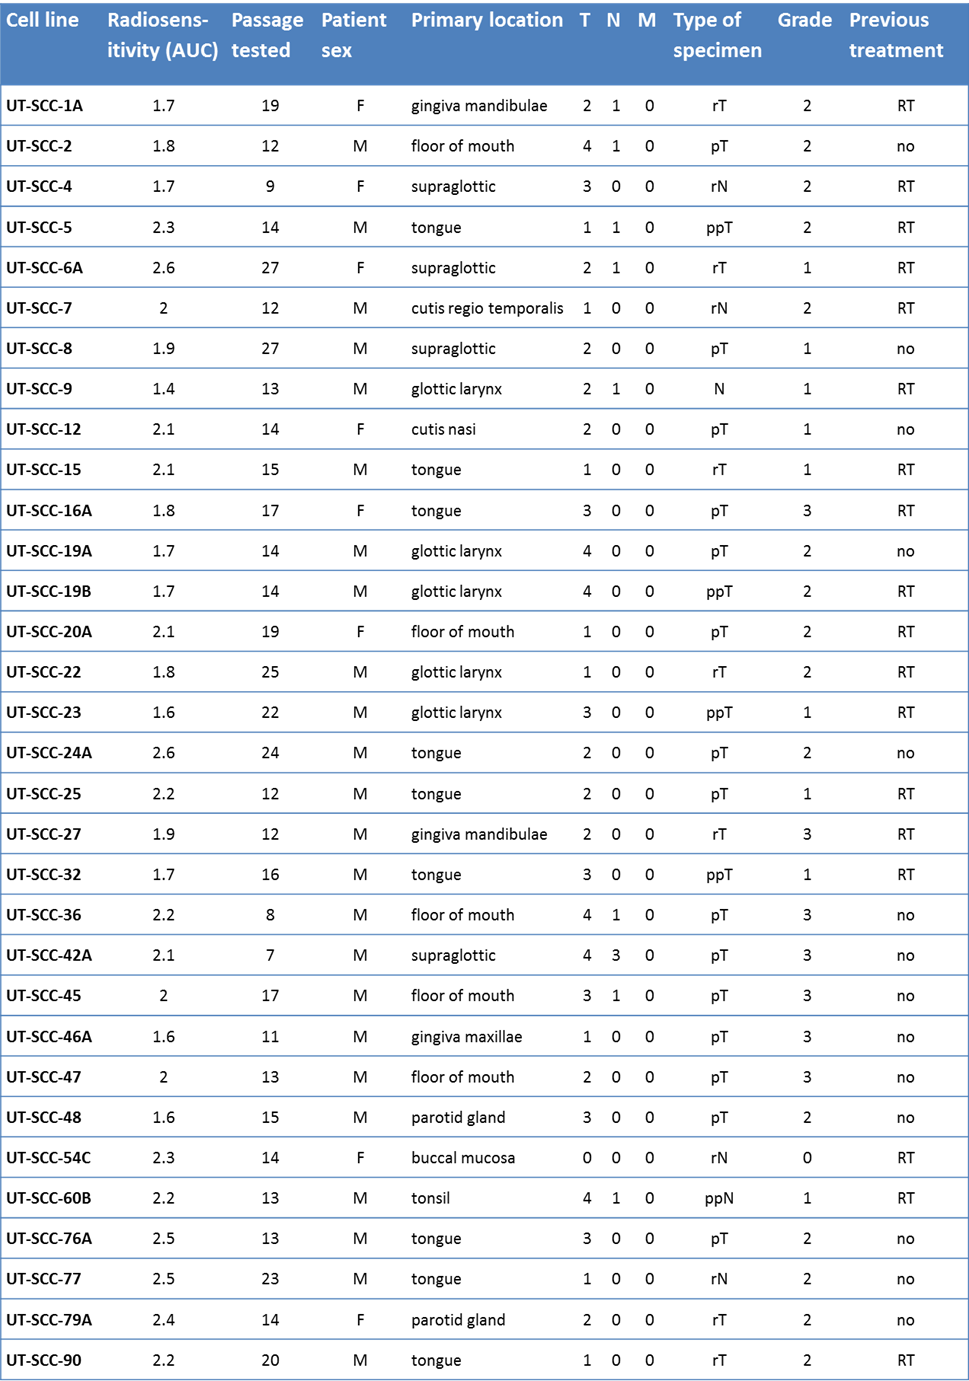
Table 4.1. Overview of the properties of all 32 cell lines. p= primary tumor, r= recurrent tumor, pp = persistent primary tumor, T=from the primary tumor location, N = from the lymph node.
Cell culture.
All cells were cultured in DMEM, supplemented with 1% l-glutamine, 1% nonessential amino acids, 10% FBS, and antibiotics. Cells were incubated in humidified air with 5% CO2 at 37°C. Depending on the doubling time, cells were subcultured every 3 to 14 days to ensure exponential growth. Cells were used for experiments when they were around 60% to 70% confluent. Preferably, low passages (10–20) were used.
Validation cell lines.
The UT-SCC-43A and UT-SCC-43A-Snail cell lines were developed and provided by Dr M. Takkunen (University of Helsinki, Helsinki, Finland; ref. 21). The FaDu-cDNA3 and FADU-HIF1α(ΔODD) cell lines were developed and provided by Prof. Kou-Juey Wu (National Yang-Ming University, Taiwan, ROC; ref. 22). Both cell lines are human HNSCC, transfected with either the transcription factor snail or HIF1α with a deleted oxygen degradation domain, thereby causing the cells to undergo epithelial-to-mesenchymal transition (EMT).
Irradiation assay
Radiosensitivity assay.
Radiosensitivity of all cell lines was tested with a 96-well plate clonogenic assay, developed by Grénman and colleagues (23, 24). The radiosensitivity of a cell line was defined as the area under the survival curve, with measurements of the survival fraction at 6 different doses, each repeated at least 3 times. When a comparison was made between radioresistant and radiosensitive cell lines, the cutoff was set at a median area under the curve of 2.0.
RNA collection after irradiation.
Cells were irradiated using a 137Cs irradiation unit with a dose rate of 0.662 Gy/min. Mock-irradiated cells were harvested for all cell lines, as well as cells at 2 and 6 hours after 4 Gy. At the given time points, cells were rinsed with ice-cold PBS twice and then collected in RNA-Bee (Campro Scientific).
RNA isolation from cell lines
All steps from RNA isolation to microarray hybridization were performed at the Institute’s central microarray facility. Cells in RNA-Bee were used to extract total RNA. The sample was then split into two for analysis of miR and mRNA separately. mRNAs were further purified using the RNeasy Mini Kit and the RNase-Free DNase Set from Qiagen. The RNA was isolated and DNAse treated using the spin columns according to the manufacturer’s instructions. The Agilent 2100 Bioanalyzer was used to confirm the presence of intact RNA.
mRNA/miR microarrays in cell lines
mRNA.
Biotin-labeled cRNA was generated using the Illumina TotalPrep RNA Amplification Kit (AMIL1791, Ambion Inc.). Briefly, to synthesize biotin-labeled cRNA, 350 ng of total RNA was reversed transcribed and subsequently amplified and labeled with biotin (in vitro transcription). Next, the cRNA (1,500 ng per array) was hybridized to v3 Illumina bead arrays according to the manufacturer’s instructions (Illumina, Inc.). Array signals were developed by Amersham fluorolink streptavidin-Cy3 (GE Healthcare Bio-Sciences) following the BeadChip manual. Fluorescence intensities were measured with the scanner and averaged per probe. Background adjustment was done using the method from the affy package, after which data were log2-transformed and robust spline normalized. As a final step, annotations were updated using the lumiHumanAll package (25) in R and subsequently the data were aggregated per gene symbol: data from probes with the same gene symbol and a correlation greater than 0.7 were averaged.
microRNAs.
Using the Exiqon miRCURY LNA microRNA Array kit (fifth generation), 1 μg total RNA was labeled with Hy3 and hybridized in a TECAN HS4800 Hybridization Station against the slides together with a reference pool of all samples (Hy5). The slides were scanned in a DNA Microarray Scanner (Model G250B, Serial number US22502518) from Agilent Technologies, which uses Scan Control software (Version A.6.11). After subtraction of the mean background signal, arrays were log2-transformed and normalized using the LOWESS method (using Imagene 6.0 software).
Patient series
Patient selection.
Thirty-four patients treated at The Netherlands Cancer Institute (Amsterdam, the Netherlands) between 2002 and 2010 were selected as a validation cohort. To avoid confounding by the addition of surgery or chemotherapy, a cohort consisting of patients with T2-3 laryngeal cancers was compiled. These patients were all treated with radiotherapy alone with a curative intent. The series was designed to be a matched cohort of 17 patients with local recurrences matched with 17 local cures. There were no significant differences between groups with and without local recurrence in age, gender, subsite, T-stage, or treatment year (Table 4.2).
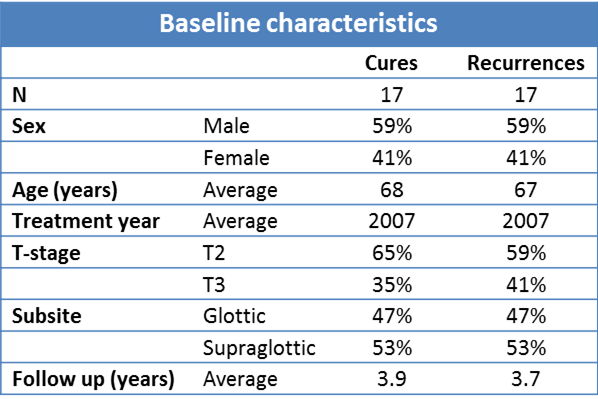
Table 4.2. Patient characteristics for the 34 patients in the validation cohort.
miR extraction.
Using the Roche High Pure miRNA Isolation Kit (REF: 05080576001), miRNAs were extracted from pretreatment biopsies. Briefly, 5 slides of 5-μm thickness were deparaffinized and macrodissected, assuring that the sample consisted of at least 50% tumor cells. miRs were further purified according to the manufacturer’s instructions.
miRNA library preparation and sequencing
The total RNA samples were quality-controlled and quantified with the Agilent Technologies 2100 Bioanalyzer, using the RNA 6000 Nano kit. One microgram of total RNA in a volume of 5 μL was used as input for the miR library preparation for Illumina sequencing (SR 50bp) using the TruSeq Small RNA Sample Preparation Kit (RS-200-0012) and Guide (Part # 15004197 Rev. E). Shortly, stepwise RNA ligation of 3′ and 5′ adapters to miRs introduce a specific index to every sample. The product was PCR-amplified and pooled and purified using a 6% PAGE gel. Fragments of 145 to 160 bp were cut from the gel, washed and concentrated by ethanol precipitation, and resuspended in nuclease-free water. The small RNA library pools were quantified using a DNA 7500 chip with the Agilent Technologies 2100 Bioanalyzer. The pools were diluted to a concentration of 2 nmol/L and passed on for sequencing onto an Illumina HiSeq2000 machine and a stretch of 50 bp was sequenced according to manufacturer’s instructions. The FAST-Q data from the run were analyzed and quantified by comparing the data to the miR databases.
Sequence reads (51 bp) were mapped using the mirExpress pipeline. The reads were trimmed for adapter sequences upon alignment. During the alignment, the identity was set to 0.9. Human mature and precursor sequences were downloaded from miRbase (version 20). The miR expression results that were generated for each sample were combined for further analysis. miR counts were normalized to 100,000 reads per patient.
Analysis
Time course analyses were performed using the Biometric Research Branch (BRB) ArrayTools (http://linus.nci.nih.gov/BRB-ArrayTools.html). This is a tool that performs a regression analysis of time course data, finding patterns that correlate with time, class, or both. Pathways and networks were analyzed through the use of Ingenuity Pathway Analysis (IPA; Ingenuity Systems, www.ingenuity.com). Cell survival curves were generated and analyzed in GraphPad Prism 6.0. All other analyses were performed in R (26), using the Bioconductor packages (27) and our own scripts.
miR target selection
Because most miR–mRNA interactions are predicted interactions on the basis of the complementarity of their RNA sequences and not on experimentally validated interactions, a collection of the most likely mRNA targets was generated for each miR by analysis of validated interaction data from external databases. A maximum of 750 mRNA targets per miR were selected on the basis of our own prediction model trained to predict experimentally validated targets from Tarbase 6.0 (28) on miR and target properties from TargetScanHuman 6.2 (14, 29). A list of these 146,898 interactions is available online.