Patients
Of 92 advanced HNSCC patients with gene expression data available, patients were eligible for analysis in the current series if they had a stage III/IV (M0) tumor and there was a good quality MRI or CT scan on which to measure the primary tumor volume. In the previous analysis by Pramana et al. [32], oral cavity and larynx cancer patients were excluded from the final analysis because they showed very different survivals after treatment and could therefore have confounded the effect of gene expression. For the current analysis, we decided to include oral cavity tumors, since we aimed to study whether the effect of gene expression was independent of clinical factors. Larynx cancer patients were not deemed representative for this study population because according to the Dutch Consensus guidelines they do not usually receive chemoradiotherapy [34].
Treatment
All patients were categorized as anatomically or functionally inoperable and treated with curative intent. Treatment consisted of cisplatin-based concomitant chemoradiotherapy regimens in phase II/III studies at the Netherlands Cancer Institute. The different schedules all included irradiation with 70 Gy in 35 fractions over 6-7 weeks. Chemotherapy was administered either intra-arterial (i.a.) 150 mg/m2 on treatment days 2, 9, 16 and 23, intra-venous (i.v.) daily low dose (6 mg/m2) cisplatin or intra-venous on treatment day 1, 22 and 43 (100 mg/m2). There was no significant difference in outcome between intra-arterial and intra-venous chemoradiotherapy [35].
Chung gene expression profile
The methods for generating expression profiles have been described previously [32]. Briefly, gene expression profiles were measured on pre-treatment biopsies of all patients. Different published gene sets were tested, of which a “high risk” signature published by Chung et al. [31] was the most significant predictor of locoregional recurrence. Unigene identifiers were used to map the 42 Chung genes to the latest annotations of the NKI array. When more than one probe mapped to the same Unigene cluster, the probe with the least missing values and with the highest interquartile range (IQR) was used. This resulted in 32 genes to be used for analysis. For each patient, Pearson correlations were calculated against the Chung score. Patients were grouped into those who had a negative or positive correlation of their gene expression values with the high risk Chung profile, representing a predicted low or high risk, respectively.
HPV profile
Since there was no DNA available to test for infection with HPV, gene expression was used to assess HPV infection status. Slebos et al. published a set of 20 genes that were upregulated when HPV is transcriptionally active [33]. Symbols for these genes were updated from the NCBI Entrez Gene database (www.ncbi.nlm.nih.gov/sites/entrez), and the corresponding probe numbers on the NKI array selected. In this way, 12 of the 20 genes could be mapped to the NKI array and were used as the HPV signature (table 2.1). When more than one probe mapped to the same gene, the probe with the least missing expression values across the patient series and with the highest interquartile range (IQR) of expression between the patients was used. Since only upregulated genes were used, average expression of these genes was calculated for every patient and the median of the average expression values used to divide patients into two groups, the group with low HPV gene expression (under the median) being considered HPV negative-like and the group with high HPV gene expression being considered HPV positive-like.
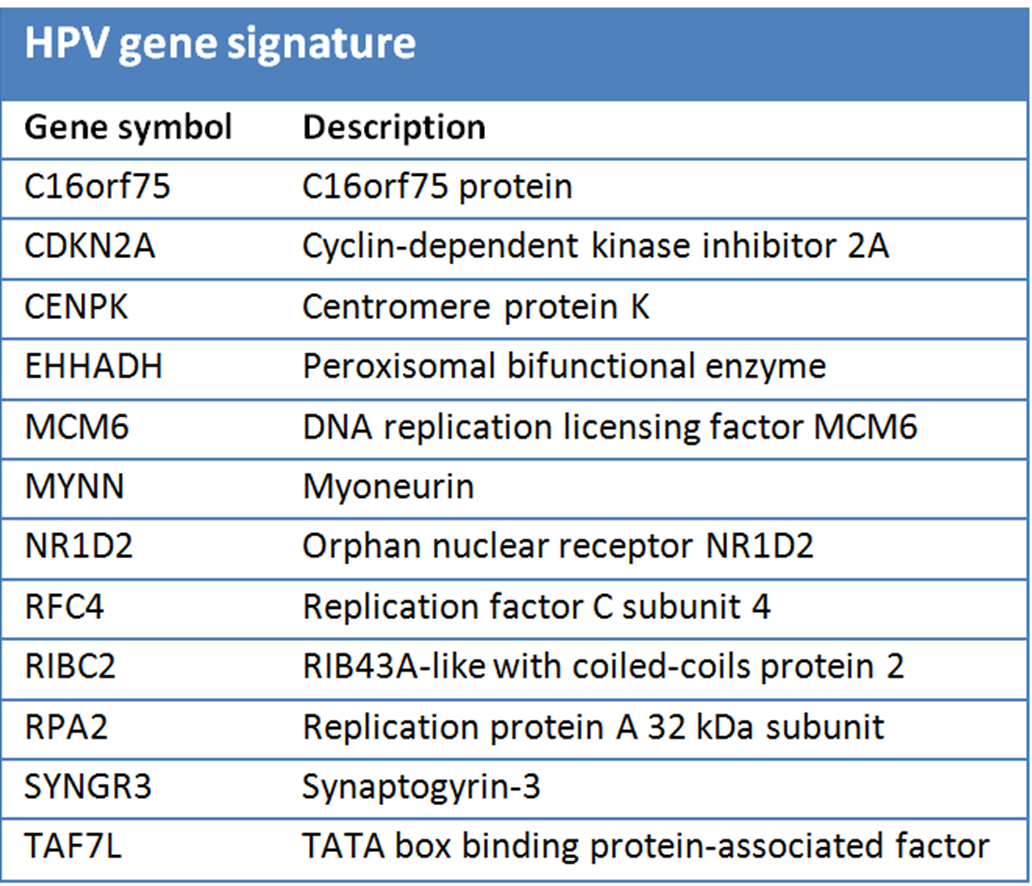
Table 2.1. HPV gene signature: The 12 upregulated genes from the Slebos study [33] that could be mapped to our microarray platform and were used to determine HPV profile status.
Tumor volume
The pretreatment CT or MRI scan was used for primary tumor volume measurement. All visible primary tumor was manually delineated on every CT or MRI slice. Pathological lymph nodes were not included. Tumor volume was calculated after triangulation of the surface of the delineations [20].
Statistics
The primary endpoint for this study was local control. A local recurrence was defined as a pathologically proven recurrence at the site of the primary tumor. Time to local recurrence was calculated from the date of diagnosis until local recurrence, death, loss to follow-up or end of follow-up, whichever occurred first. Events other than local recurrence resulted in censoring of time to local recurrence. The association with local control was evaluated for gender, age at diagnosis, primary tumor site, T and N-stages, primary tumor volume, Slebos HPV expression status and Chung gene expression status by Kaplan-Meier plots and corresponding log-rank tests as well as by hazard ratios (HR) and 95% confidence intervals (CI) based on Cox regression. Age at diagnosis was dichotomized at the median among patients with a recurrence; tumor volume was dichotomized using a 30 cc cut off. Trend tests were based on the slope of the continuous variable. Variables with a HR>1.5 or <0.5 or a p-value<0.05 for at least one category in univariate analyses were included in a multivariate model. Kaplan-Meier curves were generated in GraphPad PRISM 5.01. All other analyses were performed using SPSS 15.0. Based on the results of the multivariate analysis, patients were grouped according to their total number of independent risk factors for local recurrence.
Comparison with a larger series
The present dataset was limited to patients who had available gene expression data. To assess reproducibility of the results found for clinical factors, we compared our results to the results of a series of 360 patients also treated with radiation plus cisplatin and from which 75% of the present study patients were taken [20].