Data overview
All tested cell lines responded to irradiation by profound changes in gene expression. To investigate whether this response correlates with radioresistance, we determined the abundance of 18,913 unique mRNAs at 0, 2, and 6 hours after 4 Gy and of 279 unique miRs at 0 and 6 hours after 4 Gy in 32 HNSCC cell lines (Figure 4.1).
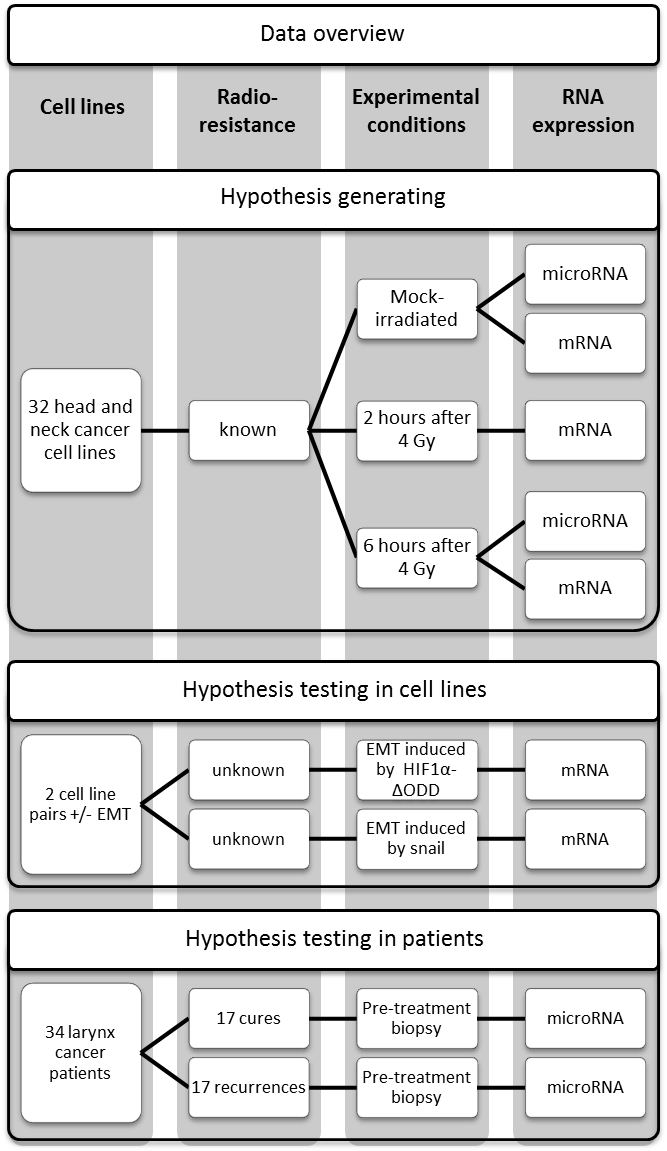
Figure 4.1. Overview of data.
MiR/mRNA expression changes 2 and 6 hours after 4 Gy do not correlate with radioresistance
Thousands of mRNAs and miRs showed expression changes in one or more of the cell lines in response to 4 Gy. The time course plug-in in BRB array tools identifies cell lines with similar gene up- or downregulation after irradiation. An expression response pattern common to all 32 cell lines involved 175 genes (Figure 4.2), none of them encoding miRs. When analyzing these common response genes in IPA, the most significant canonical pathways were associated with protein ubiquitination, cell-cycle regulation, and DNA double-strand break repair.
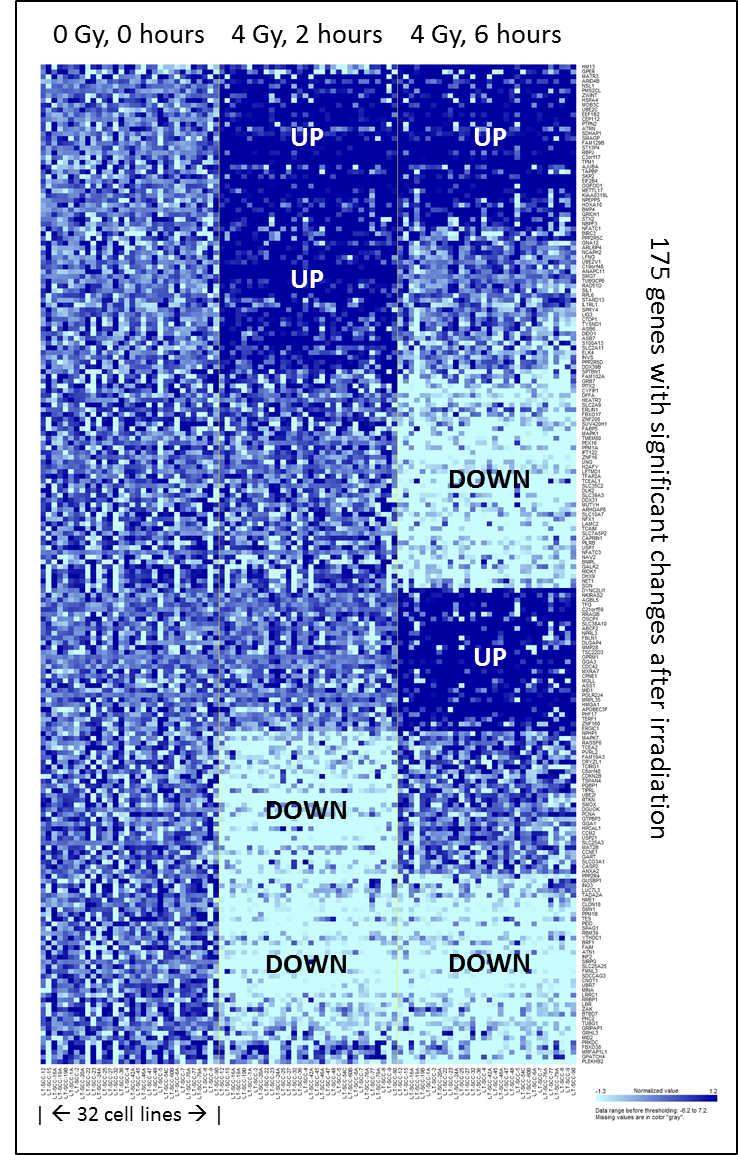
Figure 4.2. Heatmap of common response, 2 and 6 hours after irradiation: Heatmap of the common response to 4 Gy irradiation in all 32 cell lines, adapted from the BRB-array tools time course plug-in output.
When genes with an altered expression 6 hours after 4 Gy (compared with baseline expression) were subjected to cluster analysis, 2 main response clusters became evident. Genes that were different between the 2 response clusters were analyzed in IPA, which showed that 11 cell lines in the first cluster had an activated TP53 and HNF4A response, whereas this response was inhibited in the other 21 cell lines. However, the 2 clusters showed no correlation with radioresistance (t test; P = 0.82).
The time course plug-in also searches for response patterns that are significantly different between 2 groups. Here we found that changes 2 and 6 hours after 4 Gy did not differ between the 14 radiosensitive and 18 resistant cell lines, neither in mRNA nor in miR expression.
mRNAs and radioresistance
The BRB time course plug-in further analyzes the difference between sensitive and resistant cell lines, independent of the time response. In this analysis, 1,226 genes with a stable expression over the 3 time points significantly correlated with radioresistance using a false discovery rate cutoff of <0.05 (Supplementary table 4.1). In addition, separate t tests were performed between the expression of the sensitive and resistant groups for each of the 3 time points. The 3 resulting P values were then pooled per gene. The expression over time for the top 5 positively and negatively correlated genes (i.e., with the lowest pooled P value) is shown in Figure 4.3A and B. An IPA analysis showed that these 1,226 genes corresponded mostly with the following molecular and cellular functions: cellular movement, cellular development, cellular growth and proliferation, cell-to-cell signaling, and interaction and cell morphology. These functions are suggestive of a role for EMT, which describes a process in the cell that leads to loss of polarity, increased migratory and invasive capacity, and reduced cell–cell contact (30).
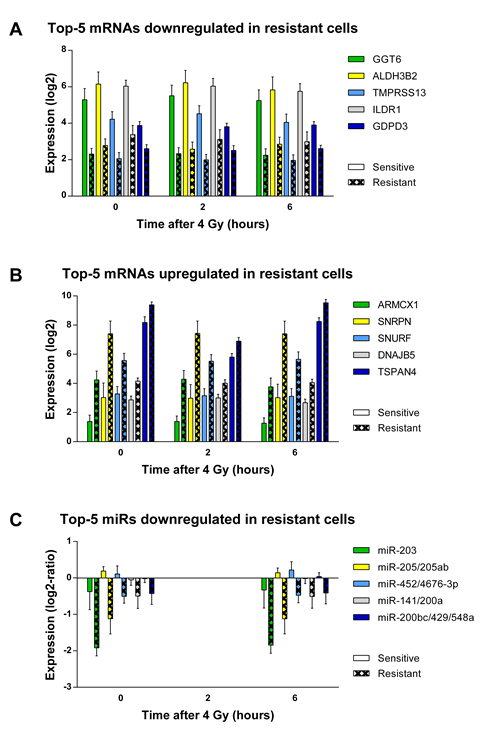
Figure 4.3. MiR and mRNA expression differences between resistant and sensitive cell lines. mRNA and miR expression differences between sensitive and resistant cell lines over time. The differences between sensitive and resistant cell lines at the individual time points were all individually significant (t test; P < 0.05), except for miR-141/200a and miR-200bc/429. The differences between sensitive and resistant cells for these two miR families were only significant, when the measurements at both time points were considered. Error bars, mean ± SEM.
Identification of miRs that correlate with radioresistance
To find driving miRs that influence radioresistance, we set 3 separate requirements: (i) to select miRs that were actively degrading their mRNA targets, there had to be a negative correlation between miR expression and expression of its targets; (ii) a correlation between miR expression and radioresistance; and (iii) an inverse correlation of the target expression with radioresistance (compared with the miR–radioresistance correlation). Using these criteria, the chance of finding false-positive results is brought down to a minimum and only relevant miRs are identified.
For this analysis, miRs and mRNAs were filtered on the basis of the interquartile range (IQR) of expression between the 32 cell lines to exclude uninformative values. This left 200 miRs and 13,041 mRNAs with an IQR higher than 0.5 for the analysis. Of the 200 miRs, 39 were discarded because they had fewer than 5 predicted targets. After the filtering steps, the remaining 161 miRs had an average number of 506 predicted mRNA targets, as defined by our in silico generated miR–mRNA interaction database. Of these 161 miRs, 37 had a significantly negative miR target Pearson correlation after multiple testing correction. P values for the correlation between each miR and its targets were calculated using a two-sided t test of the Pearson correlations of the predicted mRNA targets for each miR versus the Pearson correlations of all other (random) mRNAs with the miR expression. P values for the correlation between mRNA targets and radioresistance were calculated using the same approach, comparing the difference between all P values for the Pearson correlations between the targets and radioresistance versus all P values for the correlations between the nontarget mRNAs and radioresistance. P values for the difference in miR expression between sensitive and resistant cell lines over the two time points were obtained using the BRB time course plug-in. A significant correlation of the miR and its targets with radioresistance was observed for 12 of these 37 miRs, belonging to 10 different miR families (Table 4.3). Expression over time for the top 5 miR families can be seen in Figure 4.3C. Of interest is that 292 of the earlier identified 1,226 mRNAs that were significantly correlated with radioresistance are being regulated by one of these 12 miRs.
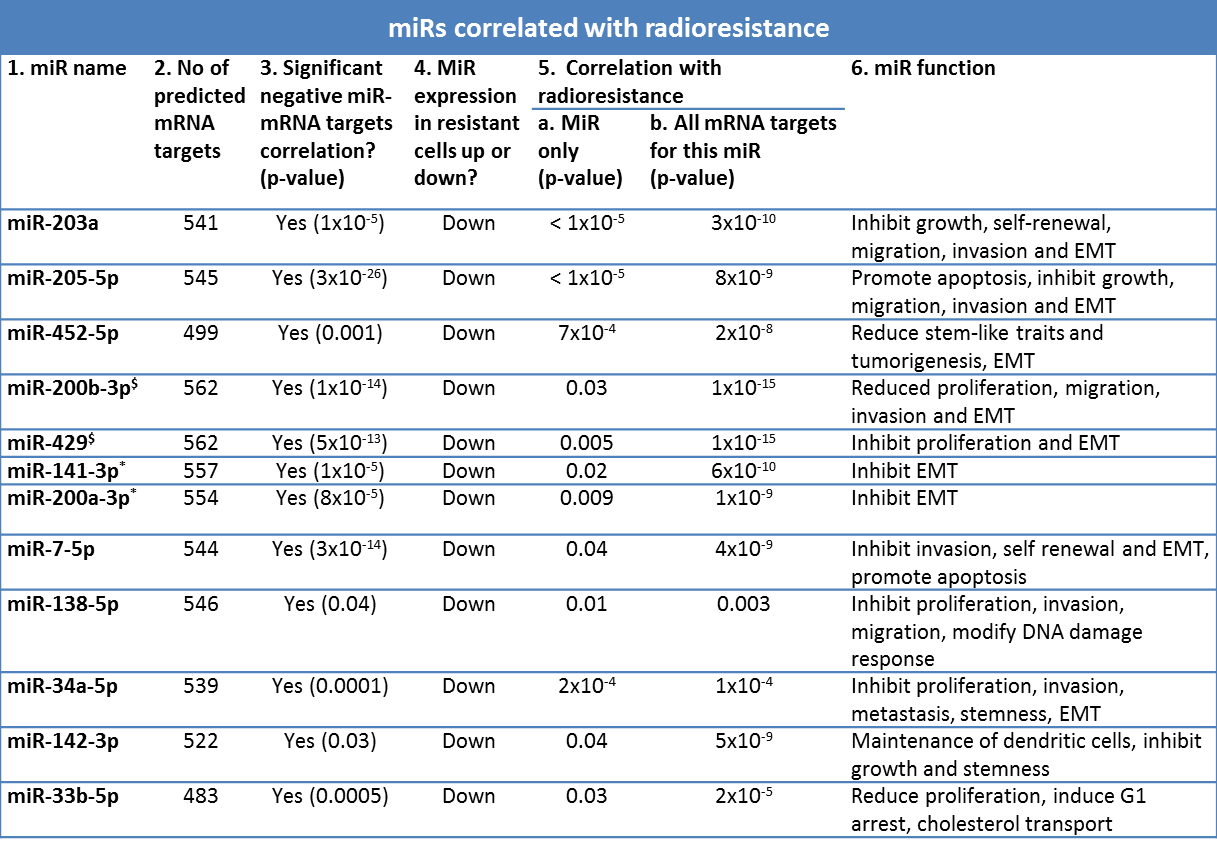
Table 4.3. Relevant miRs correlated with radioresistance: Properties of the miRs and their associated mRNA targets that were significantly correlated with radioresistance. Column 1: miR name. Column 2: The number of predicted mRNAs that are being targeted by this miR. Column 3: A significant negative correlation between the miR and its predicted targets indicates that this miR is actively degrading its targets. Column 4: The direction of the miR expression in the group of resistant cell lines. Column 5a: p-values from the BRB array tools time course plug-in, representing the correlation between radioresistance (AUC) and the expression of the miR over the 2 measured time points. Column 5b: p-value of a 2-sided T-test comparing the difference between all p-values for the Pearson correlations between the predicted mRNA targets and radioresistance versus all p-values for the correlations between the non-target mRNAs and radioresistance. Column 6: all references for the described miR functions can be found in Supplementary table 4.2. $Both member of miR family miR-200bc/429/548a. *Both member of miR family miR-141/200a.
EMT correlates with radioresistance
From the data described in mRNAs and radioresistance and identification of miRs that correlate with radioresistance, it appears that the loss of miRs downregulating EMT mRNAs were significantly correlated with the intrinsic radioresistance of these 32 HNSCC cell lines.
To verify that EMT had a causal relation with radioresistance, we collected 2 HNSCC cell lines that had been forced to undergo EMT: UT-SCC-43A-Snail and FaDu-HIF1α(ΔODD). Both Snail and HIF1α are known transcription factors for EMT. In cell culture, the Snail- or HIF1α-expressing cells were clearly mesenchymal, whereas the respective control cells lines UT-SCC-43A and FaDu-cDNA3 had an epithelial growth pattern. In these pairs, we found that the cells that had undergone EMT were significantly more resistant to radiotherapy (Figure 4.4), with areas under the survival curve increasing from 2.7 to 3.9 (P < 0.0001) in the FaDu pair and from 2.6 to 4.6 (P < 0.0001) in the UT-SCC-43A pair.
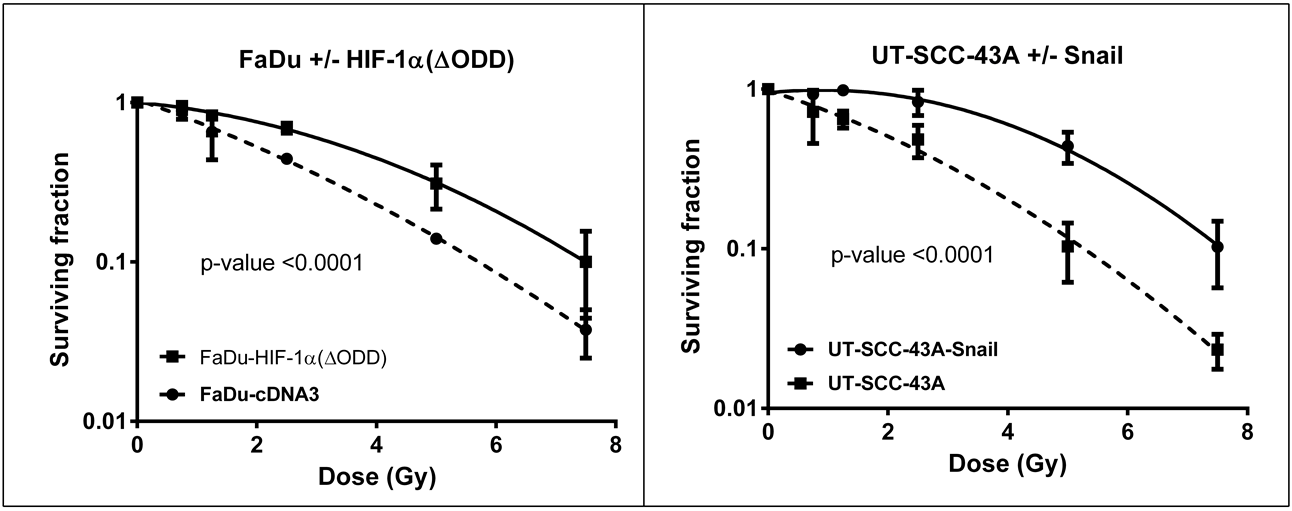
Figure 4.4. Induction of EMT causes radioresistance. Induction of EMT by HIF1α (left) or Snail (right) leads to increased radioresistance.
We further tested the correlation between radiosensitivity and processes known to influence radiotherapy response in the 32 cell lines, by using published gene sets for reactive oxygen species (31), hypoxia (32, 33), proliferation (34), stem cells (single marker CD44 and the set from ref. 35), p53 (constructed ourselves, Supplementary table 4.3), DNA repair (constructed ourselves, Supplementary table 4.3), and intrinsic radiosensitivity (8, 9). We also constructed our own HNSCC EMT signature from the two pairs of HNSCC cell lines in which EMT was induced. This signature was constructed from genes with a fold change greater than 2 or under 0.5 between parental and EMT-induced strains. In addition, only genes were selected that showed a fold change in the same direction (up- or downregulation) in both cell line pairs, which resulted in a set of 1,189 genes (Supplementary table 4.4).
For each cell line, a score was generated for each gene set, by either calculating the mean expression of the genes in the set or in the case of the HNSCC EMT signature by calculating the Pearson correlation between the expression of the cell line and the average expression in FaDu-HIF1α(ΔODD) and UT-SCC-43A-Snail cell lines for these 1,189 genes. Next, scores for the gene sets were compared with the radiosensitivity values. Of the different gene sets, the HNSCC EMT gene set was the best predictor of radiosensitivity (linear regression P: 0.001) in the panel of 32 HNSCC cell lines, with a Spearman correlation of 0.74 (P < 0.0001). A plot of the HNSCC EMT score against the radiosensitivity is shown in Figure 4.5, the individual scores per cell line can be seen in Supplementary table 4.5.
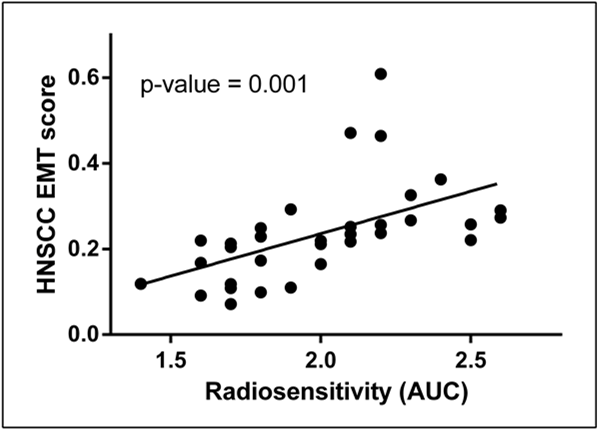
Figure 4.5. HNSCC EMT score versus radiosensitivity. Cells with a higher score for EMT (more mesenchymal) are more resistant to irradiation.
Of note is that the two EMT-inducible cell lines, although HNSCC cells, were not part of the 32 cell line panel and thus were an independent test system, strengthening the interpretation of an EMT-based mechanism for radioresistance.
miRs predicting radiotherapy response in patients
The expression of the most significant miR in cell lines (miR-203) was tested in a pilot series of 34 patients with T2-3 larynx tumors treated with radiotherapy. The 12 top miRs were analyzed. When two groups created were divided by the median expression, a trend was seen for higher recurrence percentages with low expression of miR-452 (HR, 0.5; P = 0.1), miR-200b (HR, 0.7; P, 0.4), and miR-141 (HR, 0.6; P = 0.4). However, only low miR-203 expression was significantly correlated with local recurrence in a multivariate Cox regression (Figure 4.6; HR, 0.364; log-rank P = 0.04). These findings are in line with the cell line data, that is, loss of miR-203 expression leads to radioresistance.
